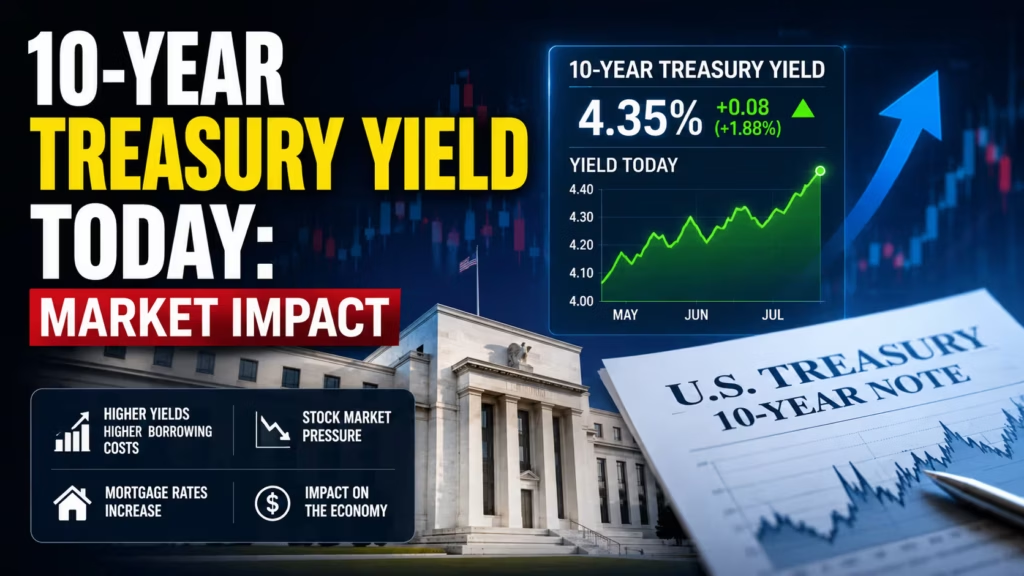
The 10-year Treasury yield is trading around 4.62% this week, sitting near its highest level in almost two months. The move higher has been driven mainly by a spike in oil prices tied to Middle East tensions, along with investors bracing for fresh inflation data and Fed Chair testimony. Here’s what’s moving the number and why it matters for your mortgage, your stock portfolio, and the broader economy.
Key takeaways:
- Current level: The 10-year yield is around 4.62%, up from 4.56% just a few trading days ago — a seven-week high.
- What’s driving it: Rising oil prices from Middle East conflict, upcoming CPI/PPI inflation reports, and Fed Chair Kevin Warsh’s Congressional testimony.
- What it means: Higher yields typically mean pricier mortgages, tighter financial conditions, and pressure on stock valuations — especially for growth and tech names.
What Is the 10-Year Treasury Yield and Why Does It Matter?
The 10-year Treasury yield is the interest rate the U.S. government pays to borrow money for a decade. It’s set daily by the market — investors buy and sell existing Treasury notes, and the yield adjusts based on that demand.
It’s often called the most important number in global finance, and for good reason. It functions as the risk-free benchmark rate that underpins:
- Mortgage rates — the 30-year fixed mortgage tracks the 10-year yield closely
- Corporate bond pricing — companies borrow at a spread above this rate
- Stock market valuations — higher yields make future earnings worth less in today’s dollars, pressuring market cap across equities, particularly growth stocks
- Global capital flows — rising U.S. yields pull money away from emerging markets, strengthening the dollar
10-Year Treasury Yield Today: The Latest Numbers
As of this week, the 10-year Treasury yield is hovering around 4.62%, close to its highest point in nearly two months.
Here’s how the broader yield curve looks right now:
| Maturity | Yield |
|---|---|
| 3-Month | ~3.79% |
| 1-Year | ~4.06% |
| 2-Year | ~4.21% |
| 5-Year | ~4.31%–4.36% |
| 10-Year | ~4.62% |
| 30-Year | ~5.06% (trading above the key 5% level) |
The curve remains upward-sloping, with the 10-year vs. 2-year spread at roughly +36 basis points and the 10-year vs. 3-month spread at about +78 basis points. A positive, non-inverted spread like this typically signals the bond market isn’t pricing in an imminent recession, though it does point to a cautious growth outlook combined with persistent inflation pressure.
Historical Price Performance
The recent move higher marks a meaningful shift. Yields <cite index=”3-1″>climbed to 4.57% earlier this month as jumping oil prices reignited inflation fears</cite>, then <cite index=”2-1″>rose to 4.59% on Monday, reaching the highest level in nearly two months</cite>, before <cite index=”2-1″>holding around 4.62% on Tuesday as escalating Middle East tensions drove oil prices sharply higher</cite>. The 30-year yield has also pushed <cite index=”3-1″>above the key 5% threshold</cite> in the same stretch, underscoring how broad-based the move has been across the long end of the curve.
Fundamental Analysis and Market Potential (What’s Driving Yields Higher)
1. Middle East Tensions and Oil Prices
The single biggest catalyst right now is geopolitical. <cite index=”2-1″>Tensions escalated after President Trump unveiled plans to reinstate a blockade on Iranian vessels transiting the Strait of Hormuz and to seek reimbursement from countries benefiting from U.S. efforts to secure the shipping lane</cite>. <cite index=”2-1″>Tehran responded by declaring the strait closed “until further notice,” while Trump said the U.S. would reinstate its blockade and impose a 20% fee on cargo transiting the route</cite>.
That standoff has pushed oil prices sharply higher, and rising energy costs feed directly into inflation expectations — which pushes bond yields up, since investors demand higher compensation for lending money when future purchasing power looks shakier.
2. Fed Rate-Hike Expectations Have Flipped
Perhaps the most striking shift: markets have gone from pricing in rate cuts to pricing in a possible rate hike. <cite index=”2-1″>Markets are now pricing in roughly a 51% chance of a Fed rate hike in September, compared with a 23% probability the central bank leaves rates unchanged</cite>. Just days earlier, <cite index=”2-1″>traders were pricing the probability of a September hike at around 71%</cite> — a dramatic reversal from the rate-cut expectations that dominated markets earlier in the year.
“Positive long-short spreads, little changed on the day, remain consistent with a cautious growth outlook and persistent inflation that point to the Fed holding rates at the late-July meeting,” notes research from StreetStats, pointing to elevated term premium and steady Treasury issuance as forces keeping benchmark yields “higher for longer.”
3. Inflation Data and Fed Testimony on Deck
Investors are also watching <cite index=”2-1″>this week’s CPI and PPI reports for further insight into inflation trends, along with Fed Chair Kevin Warsh’s testimony before Congress for clues on the central bank’s policy path</cite>. Any upside surprise in inflation data, combined with a hawkish tone from Warsh, could push the 10-year yield even higher in the days ahead.
Key Risks and Volatility Factors
- Oil price shocks: Further escalation around the Strait of Hormuz — a chokepoint for roughly a fifth of global oil flows — could keep energy-driven inflation pressure elevated.
- Fed policy uncertainty: A shift from expected cuts to a possible hike introduces real volatility into rate-sensitive assets, from mortgage REITs to long-duration tech stocks.
- Fiscal/issuance pressure: Elevated Treasury issuance and term premium are structural forces keeping long-end yields elevated independent of Fed policy.
- Global spillover: Rising U.S. yields tend to pull capital away from emerging markets, pressuring currencies like the Indian rupee and widening yield spreads that foreign investors watch closely when allocating capital.
Market Impact: What Rising Yields Mean for You
Mortgages and housing: The 30-year fixed mortgage rate tracks the 10-year yield closely, so a move toward 4.6%+ typically translates into higher borrowing costs for homebuyers and can cool refinancing activity.
Stocks: Higher discount rates weigh more heavily on long-duration growth and tech stocks, since more of their expected value sits in future — not current — earnings. Dividend-paying value stocks and financials, by contrast, can sometimes hold up better or even benefit from a higher-rate environment.
The dollar and emerging markets: Higher U.S. yields tend to strengthen the dollar and draw capital away from emerging markets, pressuring currencies and increasing the relative cost of dollar-denominated debt abroad.
Bond portfolios: Existing bondholders see the market value of their older, lower-yielding bonds decline as new bonds are issued at higher rates — a core bond-math relationship worth remembering during any bull run in yields.
The 10-year Treasury yield’s climb to around 4.62% reflects a market grappling with a genuine geopolitical oil shock, a possible Fed pivot back toward tightening, and inflation data that could tip the scales either way in the coming days. For now, the yield curve stays upward-sloping and non-inverted, but the sharp swing in Fed rate-hike odds over just a few trading sessions is a reminder of how quickly the rate picture can change.
For the most current reading, check live data from the U.S. Treasury’s daily par yield curve or the FRED 10-Year Treasury series.
Disclaimer: The information provided in this article is for educational and informational purposes only and does not constitute financial, investment, or trading advice. Treasury yields and financial markets are subject to volatility and can change rapidly based on economic data, geopolitical events, and central bank policy. Always do your own research (DYOR) and consult with a licensed financial advisor before making any investment decisions.