Most traders use too many indicators and end up confused. They see conflicting signals, second-guess their entries, and miss the move entirely. The fix is simpler than you think. When you use MACD and Bollinger Bands to find cleaner trade entries, you combine one momentum tool with one volatility tool — and those two perspectives together cut out a lot of the noise that trips traders up every single day.
This guide breaks down exactly how each indicator works, how they complement each other, and what specific setups give you the highest-confidence entries right now in 2026.
What MACD Does and Why Traders Use It
The MACD — Moving Average Convergence Divergence — was developed by Gerald Appel in the 1970s. It remains one of the most widely used technical indicators in the world today.
Here is what it actually measures. The MACD line is the difference between a 12-period exponential moving average (EMA) and a 26-period EMA. The signal line is a 9-period EMA of the MACD line itself. The histogram shows the gap between those two lines.
When the faster 12-period EMA crosses above the slower 26-period EMA, the MACD line turns positive. That crossover is what traders call a bullish MACD signal. When the 12-period EMA drops below the 26-period EMA, the MACD line turns negative — a bearish signal.
The histogram makes this even easier to read. When the bars grow taller, momentum is increasing. When they shrink, momentum is fading. A shrinking histogram before a crossover is often your first warning that the current move is losing steam.
The default settings of 12, 26, and 9 work well for daily and 4-hour charts. Day traders often switch to faster settings like 3, 10, 16 to catch quicker intraday moves. A MACD crossover on a weekly chart carries far more weight than one on a 1-minute chart, where false signals happen constantly.
MACD alone achieves a 54–60% win rate in backtests. That is better than random, but not the edge most traders want. The real improvement comes when you add a volatility filter — which is exactly where Bollinger Bands come in.
What Bollinger Bands Do and Why Traders Use Them
John Bollinger introduced Bollinger Bands in the 1980s, and they remain one of the cleanest tools available for reading price context relative to recent volatility.
The setup is straightforward. The middle band is a 20-period simple moving average (SMA). The upper band is that SMA plus two standard deviations of price. The lower band is that SMA minus two standard deviations. Using 20 periods and 2 standard deviations, the bands contain roughly 88–89% of all price action in most markets.
What this means practically: when price reaches the upper band, it is statistically expensive relative to recent history. When price touches the lower band, it is statistically cheap. That does not guarantee a reversal — but it tells you the market has stretched and is worth watching closely.
The most powerful Bollinger Band event is the squeeze. When the bands narrow sharply and compress together, volatility is contracting. Markets often consolidate tightly before making a large directional move. Historical data from 2023 to 2025 shows that every major Bollinger Band squeeze across Bitcoin preceded at least a 75% price move.
John Bollinger himself commented in January 2026, watching Bitcoin form a tight base near the $80,000 level: the price structure looked like a textbook squeeze setup awaiting its next directional move.
The one thing Bollinger Bands cannot tell you alone is which direction the breakout goes. That is where MACD steps in.
Use MACD and Bollinger Bands to Find Cleaner Trade Entries
The reason these two indicators pair so well is that they measure completely different things. Bollinger Bands tell you where the price is relative to volatility. MACD tells you which direction momentum is pulling. Together, they filter each other’s weaknesses.
Bollinger Bands alone generate noisy signals in trending markets — price can ride the upper band for a long time without reversing. MACD alone lags price and produces false crossovers in choppy, sideways conditions. But when both indicators agree, the quality of the signal jumps significantly.
Research from Gate.io Web3 Research in 2026 found that combining MACD with a second confirmation indicator raises the backtested win rate to 77%. A separate backtest by QuantifiedStrategies specifically testing the MACD and Bollinger Bands combination produced a 78% win rate, with an average gain of 1.4% per trade after commissions and slippage — and a maximum drawdown of only 15%.
Using multiple timeframes alongside this combination improves entry timing by approximately 40% compared to relying on a single timeframe, according to LuxAlgo research.
Setup 1: The Lower Band Bounce — Long Entry
This is the cleanest mean-reversion setup and one of the most frequently traded.
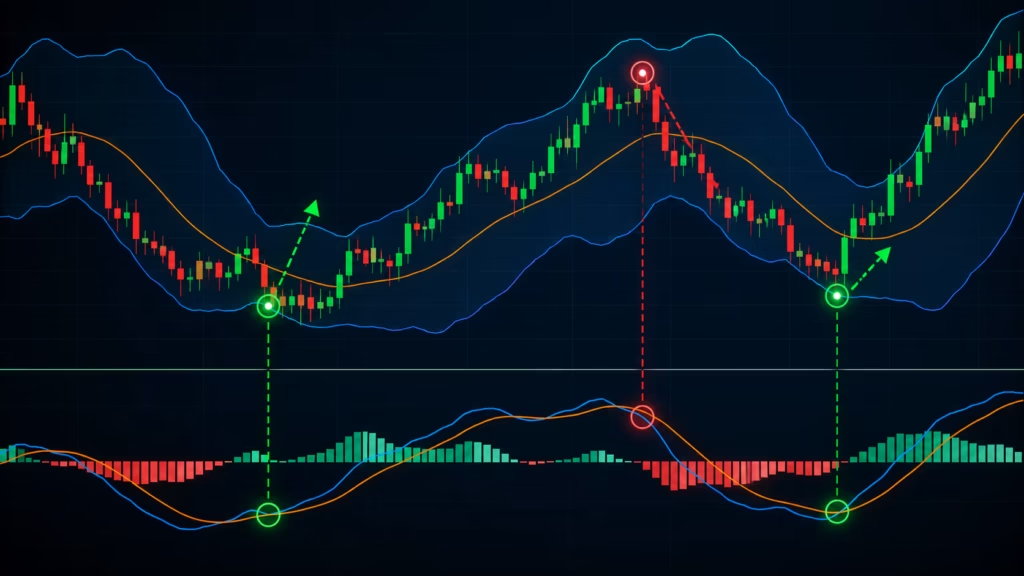
What you look for: Price falls to touch or pierce the lower Bollinger Band. At the same moment — or within one or two candles — the MACD line crosses above the signal line, and the histogram turns from red to green.
This combination tells you two things simultaneously: price has reached a statistically cheap zone (lower band), and momentum is shifting upward (MACD bullish crossover). Neither signal alone is enough. Both together form a high-confidence entry.
Place your stop-loss just below the lower Bollinger Band or the most recent swing low. Target the middle band (20-period SMA) as your first exit level, then the upper band if momentum continues.
Setup 2: The Upper Band Touch — Short Entry
This mirrors the long setup but works in reverse.
Price reaches or slightly pierces the upper Bollinger Band while the MACD line crosses below the signal line and the histogram turns from green to red. Price is statistically expensive, and momentum is shifting downward.
Stop-loss goes just above the upper band or the most recent swing high. Initial target is the middle band, with the lower band as the extended target.
In highly volatile markets — like crypto in 2025 and 2026 — you can widen the Bollinger Bands to 2.5 standard deviations instead of the default 2.0. This reduces the number of signals but improves their quality by filtering out smaller, less significant touches.
Setup 3: The Squeeze Breakout — Trend Entry
This setup catches the beginning of new trending moves and can deliver the biggest rewards.
Watch for the Bollinger Bands to narrow significantly — the squeeze. Price is compressing, volatility is low, and a big move is loading. This often shows up as a tight, sideways range on the chart.
When the bands start expanding, the breakout is beginning. Your MACD trigger: the MACD line crosses above the signal line and pushes above the zero line (for a bullish breakout), or crosses below the signal line and drops below zero (for a bearish breakout).
A MACD histogram that is growing in the breakout direction confirms the move has conviction. A shrinking histogram on a breakout warns you the move may fizzle — wait for more confirmation before entering.
In September 2025, Solana broke above its upper Bollinger Band following a sustained squeeze with MACD confirmation. It gained 45% in just 10 days — a textbook squeeze breakout where both indicators aligned cleanly.
Setup 4: The MACD Zero-Line Bounce in a Trend
This setup works best when you already know the broader trend direction from a higher timeframe.
In a strong uptrend, MACD often pulls back toward the zero line before bouncing higher. If this pullback happens while the price stays above the middle Bollinger Band, it is a low-risk long entry. The zero-line bounce confirms the trend is resuming rather than reversing.
MACD crosses below the zero line (indicating a corrective pullback) then crosses back above it — this is the trigger. Price should remain above the 20-period SMA (middle band) throughout the pullback for this to remain valid.
How to Use Multiple Timeframes With This Strategy
One of the most effective improvements you can make today is adding a second timeframe to your analysis.
Use the daily or 4-hour chart to identify the overall trend using Bollinger Bands and MACD. Is the price above the middle band on the daily chart? Is the MACD histogram positive on the 4-hour? If yes, your bias is bullish.
Then drop to the 15-minute or 1-hour chart to find the specific entry when that lower timeframe shows its own aligned signal — a lower band touch with a MACD bullish crossover.
This multi-timeframe approach aligns a broader trend context with a precise entry point. Entering only in the direction of the higher-timeframe trend while timing with the lower timeframe significantly reduces the number of trades that go wrong from the start.
What to Avoid When Using This Strategy
Avoid the tight squeeze without MACD confirmation. Just because the bands are narrow does not mean the breakout is imminent or clear. Wait for the MACD crossover and histogram expansion before entering.
Do not chase breakouts with a shrinking histogram. If price breaks above the upper band but the MACD histogram is already shrinking back toward the zero line, the breakout may be a false one. A growing histogram in the breakout direction signals conviction.
Avoid signals on a 1-minute chart. A MACD crossover on a 1-minute chart carries almost no weight — it happens dozens of times per day. This strategy works best on 15-minute charts and above.
Do not skip risk management. No indicator combination wins 100% of the time. Always place a stop-loss. Size your position so that a losing trade does not damage your account more than 1–2%.
Real-World Example: Bitcoin October 2023
One of the clearest documented examples of this combination at work happened in October 2023. Bitcoin formed a MACD golden cross — the MACD line crossed above the signal line while the histogram turned positive and expanded — just as price reclaimed the middle Bollinger Band. The subsequent rally from that entry ran 148%. Both signals fired in the same direction at the same time, giving traders who followed the setup one of the cleanest trend entries of that entire cycle.
Quick Reference: Entry Rules at a Glance
Long (buy) entry: Price touches lower Bollinger Band + MACD bullish crossover (histogram turns green)
Short (sell) entry: Price touches upper Bollinger Band + MACD bearish crossover (histogram turns red)
Breakout entry: Bollinger Band squeeze ends with expanding bands + MACD crosses in breakout direction above/below zero line with growing histogram
Trend continuation: Price pulls back to middle band in an uptrend + MACD zero-line bounce with histogram turning positive
Stop-loss: Just outside the Bollinger Band where the signal fired, or beyond the most recent swing high/low
First target: The opposite Bollinger Band or the middle band, depending on the setup
The standard settings that work well across most markets are MACD at 12, 26, 9 — meaning a 12-period EMA, a 26-period EMA, and a 9-period signal line — and Bollinger Bands at 20 periods with 2 standard deviations. These defaults are widely used because they capture meaningful price trends without overreacting to short-term noise. For day trading on faster timeframes, some traders shorten MACD to 3, 10, 16 for quicker signals. Beginners should stick to the defaults until they understand how both indicators behave before making adjustments.
Bollinger Bands tell you where price stands relative to recent volatility — when price touches the lower band it is statistically cheap, and when it touches the upper band it is statistically expensive. MACD tells you which direction momentum is moving. Bollinger Bands alone generate noisy signals in trending markets, and MACD alone lags price in choppy conditions. When both agree — for example, price touching the lower band while MACD shows a bullish crossover — the combined signal is far more reliable than either indicator would be alone.
Backtesting results are encouraging. MACD used alone achieves a win rate of approximately 54–60%. When combined with a second confirmation indicator, the win rate rises to around 77%, according to Gate.io Web3 Research in 2026. A specific MACD and Bollinger Bands backtest published by QuantifiedStrategies produced a 78% win rate with an average gain of 1.4% per trade after commissions and slippage, and a maximum drawdown of only 15%. Using multiple timeframes alongside the combination improves entry timing by approximately 40% compared to using a single timeframe.
A Bollinger Band squeeze happens when the upper and lower bands narrow sharply, meaning market volatility has compressed and price is consolidating in a tight range. This often precedes a large directional move. Historical data from 2023 to 2025 shows that every major Bollinger Band squeeze in Bitcoin preceded at least a 75% price move. MACD confirms the breakout direction: when the bands start expanding, look for the MACD line to cross above the signal line and push above the zero line (bullish breakout) or cross below and drop below zero (bearish breakout). A growing MACD histogram in the breakout direction confirms the move has momentum behind it.
Place your stop-loss just beyond the Bollinger Band where the entry signal fired. For a long entry triggered at the lower band, the stop goes just below the lower band or just below the most recent swing low, whichever is farther. For a short entry at the upper band, the stop goes just above the upper band or the most recent swing high. This placement respects the logic of the setup — if price moves significantly beyond the band that triggered your entry, the signal has failed and you need to exit. Never risk more than 1–2% of your trading account on a single trade regardless of how strong the setup looks.
Yes, this combination works well for crypto markets. The October 2023 MACD golden cross on Bitcoin preceded a 148% rally. In September 2025, Solana broke above its upper Bollinger Band following a sustained squeeze with MACD confirmation and gained 45% in just 10 days. For crypto specifically, the Bollinger Bands are worth widening to 2.5 standard deviations during periods of extreme volatility to reduce false signals. Focus on 4-hour and daily timeframes rather than very short timeframes, where crypto’s inherent noise creates too many misleading crossovers.
The most effective approach uses two timeframes simultaneously. Use the daily or 4-hour chart to identify the overall trend — check whether price is above the middle Bollinger Band and whether the MACD histogram is positive. Once you have the directional bias, drop to the 15-minute or 1-hour chart to time the specific entry when a lower band touch or MACD crossover aligns. Research from LuxAlgo shows this multi-timeframe approach improves entry timing by approximately 40% compared to trading on a single timeframe. Avoid signals on 1-minute charts, where MACD crossovers are too frequent to carry meaningful weight.