Iran Risk Spikes Across Global Markets — and investors are watching every headline. Since the U.S.-Israel joint military operation against Iran began on February 28, 2026, global financial markets have entered one of the most turbulent periods in decades. Oil prices broke past $100 a barrel for the first time since 2022. Gold hit a record high above $5,000 an ounce before retreating. Stock markets fell sharply, and volatility indices soared. In this latest analysis, we break down exactly how geopolitical tension moves oil, gold, and stocks — and what the data tells us about what comes next.
What Triggered the Latest Iran Risk Spike in Global Markets
On February 28, 2026, the United States and Israel launched a joint military operation against Iran, codenamed “Operation Epic Fury.” The operation resulted in the death of Iran’s Supreme Leader Ali Khamenei and other senior officials.
Iran responded fast. It fired retaliatory missile and drone strikes at U.S. military bases in Jordan, the United Arab Emirates, and Qatar.
Almost immediately, the Strait of Hormuz — the world’s most important oil shipping route — became a flashpoint. Commercial traffic through the Strait ground to a near standstill.
That set off a chain reaction across every major asset class.
Why the Strait of Hormuz Is the Key to Everything
The Strait of Hormuz is a narrow waterway between Iran and Oman. It sounds like just geography, but it is arguably the single most important chokepoint in the global economy.
According to UBS Global Research, the Strait handles more than one-fifth of global oil demand and nearly one-third of all seaborne oil shipments — roughly 21 million barrels per day — flowing from Iran, Iraq, Kuwait, Qatar, Saudi Arabia, and the UAE.
When shipping through it stops, the world’s oil supply tightens almost overnight.
That is exactly what happened. According to Goldman Sachs Research, around 14.5 million barrels per day of Persian Gulf crude production was effectively taken offline during the peak of the disruption, pushing global oil inventories into a record drawdown of 11 to 12 million barrels per day through April 2026.
How Iran Risk Spikes Across Global Markets: The Oil Price Story
From $70 to Over $100 a Barrel — Fast
Before the strikes, Brent crude oil traded at around $65 to $70 a barrel. By March 6, 2026, Brent had crossed $92 — a 28% surge in a single week, according to CSIS analysis. By March 9, oil prices soared past $100 per barrel for the first time since 2022. At peak, Brent touched $126 a barrel.
Goldman Sachs Research estimated that traders were demanding roughly $14 more per barrel as a risk premium — equivalent to the market pricing in a full four-week halt in flows through the Strait of Hormuz.
“The market is shifting from pricing pure geopolitical risk to grappling with tangible operational disruption,” said Natasha Kaneva, head of Global Commodities Strategy at J.P. Morgan. She noted that refinery shutdowns and export constraints were beginning to impair crude processing and regional supply flows.
J.P. Morgan projected regional production shut-ins of close to 7 million barrels per day by mid-March as storage filled and bottlenecks persisted.
What Kept Oil From Going Even Higher
Even with these dramatic numbers, oil stayed somewhat below what many analysts feared.
Why? The U.S. shale industry provided a critical buffer. According to CSIS, U.S. liquids production growth from 2008 to 2025 had already contributed roughly 70% of the expansion in global supply. That deep reservoir of domestic production capacity helped prevent an even sharper spike.
President Trump also announced measures including guaranteed naval escorts through the Strait and U.S.-backed insurance products for shipping — signals that helped reassure markets the disruption would not be permanent.
What Happened to Gold: The Safe-Haven Twist
Gold Surged — Then Reversed
Geopolitical crises almost always push gold higher. When war breaks out, investors rush to safe havens. Gold is the classic one.
True to form, gold spiked to $5,390 per ounce on February 28 — near a record high and up more than 25% year-to-date at that point, according to UBS.
But then something unexpected happened. Gold fell — and kept falling.
Why Gold Dropped Even During a War
As of mid-May 2026, gold had dropped to around $4,550 per ounce, down from its February peak.
The culprit? Inflation expectations.
The Iran conflict drove oil prices sharply higher, which drove broader inflation higher. U.S. consumer inflation rose to a three-year high. That changed the math on Federal Reserve interest rates. Instead of expecting rate cuts — which normally push gold higher — markets started pricing in rate hikes.
Higher interest rates make gold less attractive, because gold pays no interest. Investors who might have bought gold instead moved into bonds and the U.S. dollar.
The CME FedWatch tool showed zero rate cuts as the dominant scenario for 2026, and market-implied odds of a rate hike by year-end began to exceed odds of a cut.
According to Euronews, since the day before Operation Epic Fury, Brent crude surged 37%, while gold fell 10% — two assets that investors traditionally expect to move together actually went in opposite directions.
Goldman Sachs still holds a long-term gold target of $6,300 per ounce by end-2026, seeing room to recover if rate pressures ease or a deal emerges. Gregory Shearer, head of Base and Precious Metals Strategy at J.P. Morgan, noted that gold’s risk premium during past MENA conflicts has historically been “fleeting” — but added that a 5% to 10% jump in prices is possible in the near term if investor positioning in gold futures extends again.
How Stocks Reacted: Volatility, Selloffs, and Sector Splits
Equity Markets Took a Hard Hit
Stock markets did not take the news well.
The S&P 500 posted five consecutive weekly losses, falling to a seven-month low. According to Julius Baer, equity markets extended their decline as further escalation entered the picture and the conflict showed signs of becoming a more persistent geopolitical event rather than a short-lived shock.
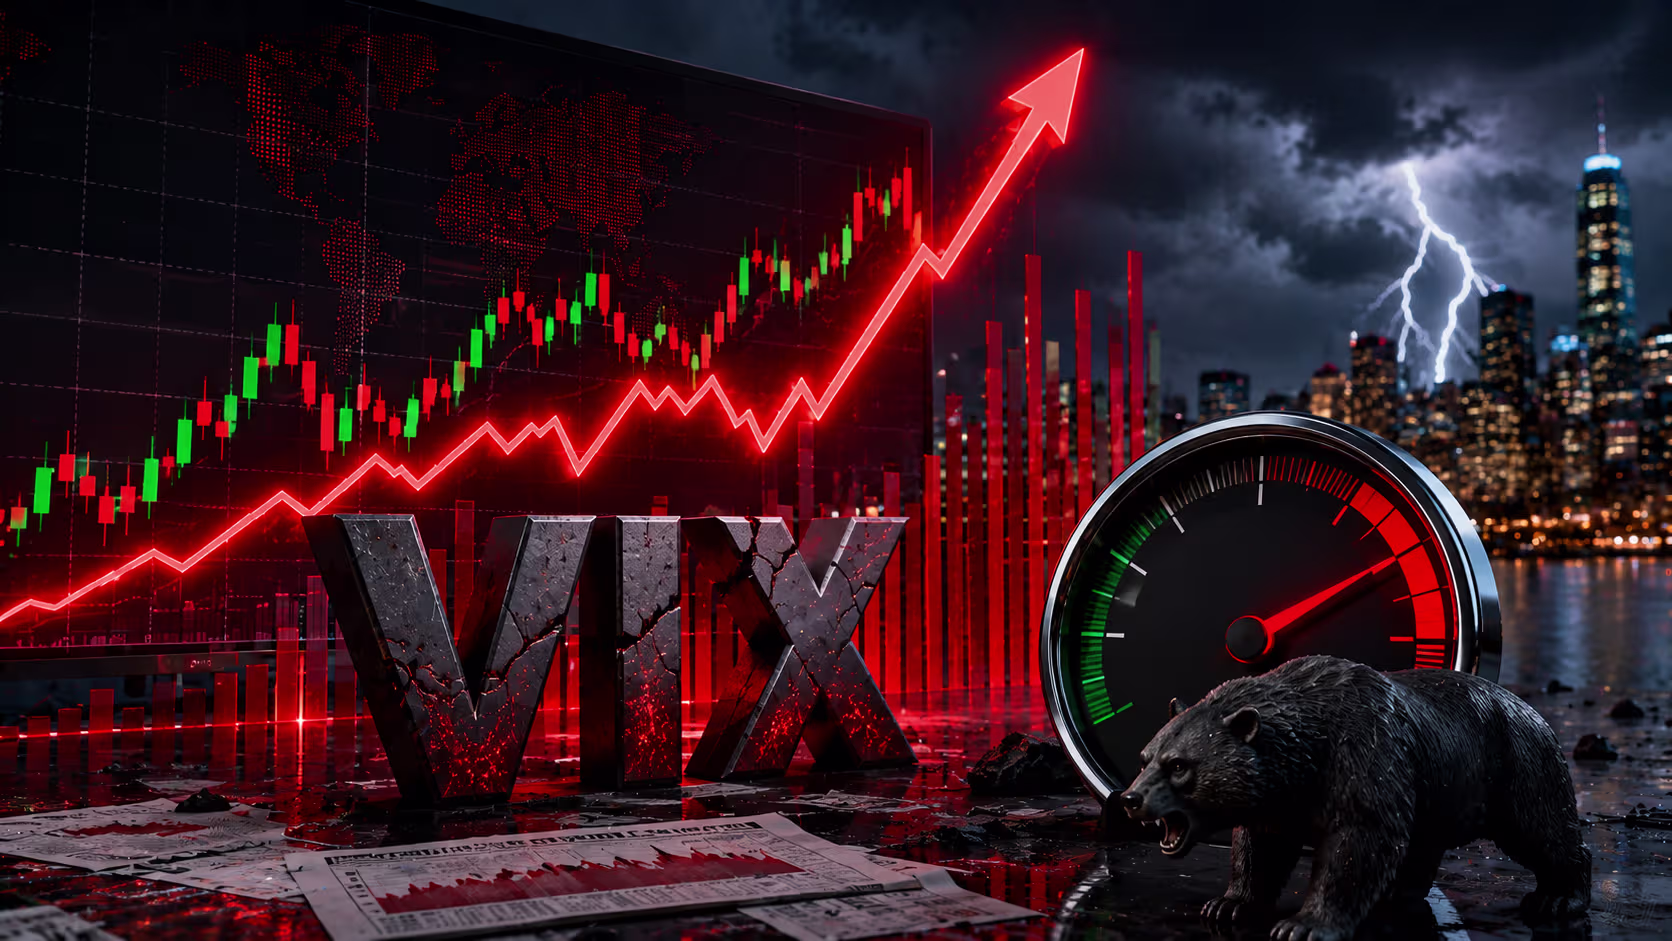
The VIX volatility index — often called the “fear gauge” — rose to levels last seen during the Liberation Day tariff turmoil in 2025, according to Julius Baer.
International Markets Were Hit Even Harder
Emerging and Asian markets bore some of the sharpest pain:
Pakistan’s KSE 100 index fell 9.57% in a single day — its largest-ever one-day decline, according to Wikipedia’s economic impact data.
South Korea’s KOSPI dropped up to 12% in a single day, triggering a circuit breaker — its biggest single-session crash since the 2008 financial crisis.
Japan’s Nikkei fell more than 2% as investors repositioned away from risk assets.
The Euro Stoxx 50 fell 2% in early trading after the strikes began.
Which Sectors Benefited
Not every part of the market fell. Defense stocks rose, as military escalation tends to signal higher defense spending. Energy sector stocks also decoupled from broader indices, climbing as oil prices surged.
UBS highlighted defense stocks across Europe as offering “structural growth and portfolio protection in an uncertain geopolitical environment.”
Stock Market Crash Fears Return as Global Investors Watch Inflation
The Bigger Economic Picture: Inflation and Growth Risks
GDP Forecasts Cut
The Iran conflict did not just move markets — it started bending macroeconomic forecasts.
J.P. Morgan Research estimated that if Brent crude prices remained at $80 per barrel through mid-2026, global GDP growth for the first half of the year could be depressed at an annualized rate of 0.6%. Higher energy prices were also projected to lift global Consumer Price Index (CPI) inflation by more than 1% annualized over the same period.
The head of the International Energy Agency described the situation as the “greatest global energy security challenge in history.”
Charles Schwab noted that the 2026 surge in oil prices year-to-date is the largest in over 40 years, based on CME Group data.
How Central Banks Are Responding
Central banks face a difficult choice. Higher oil prices push inflation up. But hiking interest rates to fight that inflation also slows growth — and adds pressure to already-stressed economies.
UBS noted that while top central banks have historically preferred not to overreact to one-off energy price spikes, they will be “mindful of the risk that inflation expectations increase, particularly given the experience of 2022–23.”
Julius Baer observed that tighter financial conditions in the U.S. will weigh more heavily on growth than in Europe, partly because U.S. consumer spending is more sensitive to falling asset prices.
Today’s Prediction: What Comes Next for Markets
De-escalation Is the Key Variable
As of mid-May 2026, diplomacy is active. Unconfirmed reports suggest a possible breakthrough, with the U.S. reportedly lifting sanctions on Iranian oil and Tehran agreeing to a long-term freeze of its nuclear program, according to Trading Economics.
Charles Schwab outlined several scenarios. Their base case: a moderate disruption that eventually resolves, allowing energy prices to ease and markets to stabilize. Their more severe scenario: prolonged supply disruption that weighs on global growth through 2026 and beyond.
Julius Baer noted that for a truly lasting energy price shock to take hold, it would require “a combination of serious energy infrastructure damage, trade restrictions outside the Gulf, or greater political chaos.”
What History Tells Us
Historically, the impact of geopolitical shocks on markets has tended to be short-lived — unless they transform into genuine economic shocks. UBS stressed that “making snap decisions to de-risk portfolios amid geopolitical conflict has historically not been a profitable strategy.”
The 1973 Yom Kippur War and the 1979 Iranian Revolution were the exceptions — both caused sustained, multi-year economic disruptions. Analysts at Julius Baer, UBS, and Goldman Sachs all note that the current conflict more closely resembles shorter-duration historical crises, but warn that much depends on whether the Strait of Hormuz reopens and energy infrastructure is repaired quickly.
What Investors Should Watch Right Now
These are the key indicators that will shape how markets move in the coming weeks:
Strait of Hormuz shipping flows — any confirmed reopening will immediately ease oil prices and stabilize risk sentiment.
Oil price direction — sustained Brent above $100 signals the market does not yet believe the conflict is winding down.
Gold and real yields — if rate-hike expectations ease, gold could recover toward Goldman’s $6,300 target.
VIX and equity momentum — Julius Baer noted that risk assets need to reclaim their 200-day moving averages for a constructive market stance to be justified.
Central bank signals — any hint of rate hikes from the Fed or ECB in response to energy-driven inflation could accelerate equity selling.
Diplomacy headlines — given how quickly markets moved on news of potential ceasefire talks, diplomatic progress will be the single fastest positive catalyst.
Iran sits beside the Strait of Hormuz, the world’s most critical oil shipping chokepoint. The Strait handles roughly 21 million barrels of oil per day — about one-fifth of global supply. Any disruption to shipping through it tightens global supply almost instantly, pushing oil prices up. In March 2026, Brent crude jumped from $70 to over $100 a barrel within two weeks of the conflict starting.
Not always. Gold typically rises in the early phase of a crisis as a safe-haven asset. But in 2026, the Iran conflict drove up oil prices and inflation expectations so sharply that markets began pricing in interest rate hikes. Since higher rates make gold less attractive, gold actually fell from its peak of $5,390 per ounce to around $4,550 — even as the conflict continued. The relationship between gold and geopolitical risk is real but not automatic.
Significantly, depending on how long it lasts. J.P. Morgan Research estimated that if Brent crude oil prices stayed at $80 per barrel through mid-2026, global GDP growth for the first half of the year could be reduced by 0.6% at an annualized rate. Global inflation could also rise by more than 1% annualized over the same period. The longer energy supplies stay constrained, the greater the economic damage.
The Strait of Hormuz is a narrow waterway between Iran and Oman in the Persian Gulf. It is the world’s most important oil shipping chokepoint, handling about 20% of global oil supply and nearly one-third of all seaborne oil shipments — roughly 21 million barrels per day. If shipping through the Strait is blocked, oil prices spike globally within days, which pushes up inflation and hits stock markets.
History suggests that panicking and selling during geopolitical shocks is rarely the right move. UBS research notes that the market impact of most geopolitical crises has historically been short-lived. However, the 2026 Iran conflict has shown more persistence than typical episodes. Analysts recommend maintaining a long-term investment focus, keeping some exposure to commodities and defense stocks as a hedge, and watching key signals like Strait of Hormuz shipping flows and central bank statements before making major portfolio changes.
Goldman Sachs holds a gold price target of $6,300 per ounce by the end of 2026. As of mid-May 2026, gold trades around $4,550 per ounce — leaving a significant gap the market has not yet priced in. Goldman’s target assumes that rate pressures ease, a ceasefire or diplomatic resolution emerges, and gold’s traditional safe-haven role reasserts itself as the acute inflation shock from oil fades.
Major Iran-related shocks have caused varied but often significant market disruptions. The 1973 Yom Kippur War and the 1979 Iranian Revolution both caused multi-year oil price shocks that drove global recessions. More recent events, such as U.S.-Iran tensions in 2019 and early 2020, caused shorter-lived spikes. Analysts at Julius Baer, UBS, and Goldman Sachs see the 2026 conflict as more serious than recent episodes but believe resolution is possible without a 1970s-style sustained shock — provided energy infrastructure is not permanently damaged.