What Is the VIX and Why Does It Move Markets?
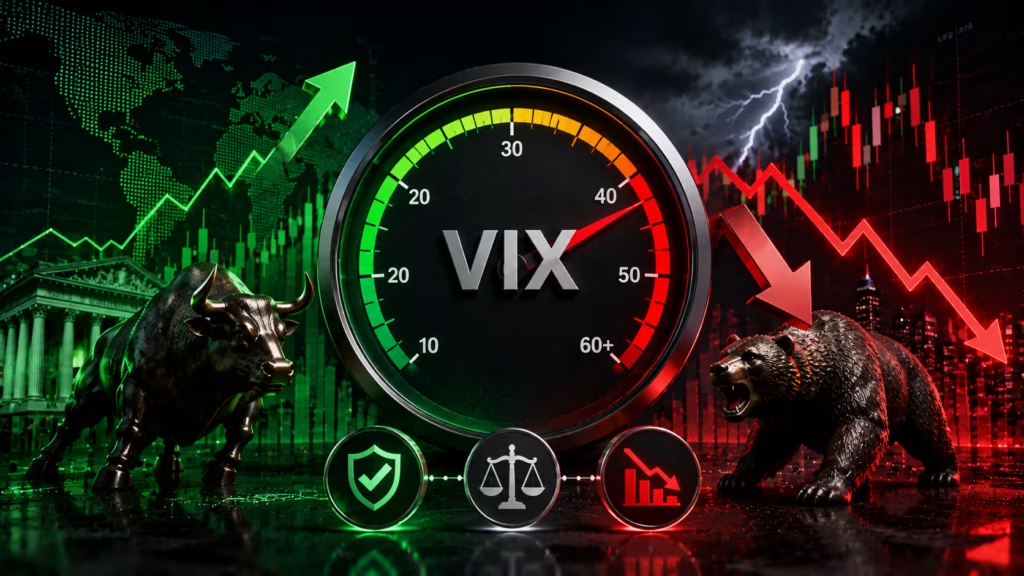
Every time the stock market turns chaotic, you hear the same word: VIX. News anchors say it is spiking. Traders check it before they do anything else. But most everyday investors have no idea what it actually is or how it works. So let us answer the question clearly: what is the VIX and why does it move markets? The answer is simpler than you think — and once you understand it, you will look at the market very differently.
What Is the VIX? The Basics in Plain English
VIX stands for the Cboe Volatility Index. The Chicago Board Options Exchange — known today as Cboe Global Markets — introduced it on January 19, 1993. The concept was developed by Professor Robert Whaley, then at Duke University, and published in the Journal of Derivatives that same year.
Prior to 1993, market volatility was calculated using historical prices, which meant investors could only see how much volatility had occurred in the past. The VIX changed that by pointing toward the future.
The VIX measures the stock market’s expected volatility over the next 30 days, based on options prices on the S&P 500 index. It does not tell you which direction the market will go. It tells you how violently prices might move — up or down — in the weeks ahead.
That is why traders call it the “fear gauge.” A high VIX means investors expect big swings. A low VIX means investors feel calm and confident.
How Is the VIX Calculated?
You do not need a mathematics degree to understand this, but it helps to know where the number comes from.
The VIX uses live S&P 500 put and call options across a wide range of strike prices. It looks at options that expire in roughly three to five weeks and interpolates them to produce a consistent 30-day reading. The result is expressed as an annualized percentage.
In 2003, Cboe partnered with Goldman Sachs to update the methodology. They expanded the calculation from a narrow group of at-the-money S&P 100 options to a much wider range of S&P 500 options. That change made the index far more representative of actual market conditions and is the version used today.
Think of it this way: when investors rush to buy options protection — especially put options — they are willing to pay more for insurance. That increased demand pushes option prices higher. The VIX captures that price rise and translates it into a single number.
In short: when traders are scared and buying protection, the VIX goes up. When traders are relaxed and not hedging, the VIX goes down.
What Is the VIX and Why Does It Move Markets? Understanding the Key Relationship
Here is the most important thing to understand about the VIX: it moves in the opposite direction from the stock market most of the time.
The VIX tends to have an inverse relationship with the S&P 500’s price. In many cases, when the stock market goes down in price, the VIX increases.
When the SPY — the S&P 500 tracking ETF — drops sharply, investors rush to buy put protection. That demand lifts option premiums and lifts the VIX. Even if you never trade volatility directly, the VIX helps you size your risk exposure.
This inverse relationship is why the VIX moves markets, not just measures them. When institutions see the VIX spike, they reduce risk. They sell stocks, move to cash or bonds, and buy hedges. That selling pressure pulls markets lower. The VIX rising can become a self-reinforcing cycle.
The high-volatility environment also increases the discount rate for growth-sensitive firms, making high valuations harder to justify. That is why a surging VIX can hit technology and growth stocks especially hard.
Reading the VIX: What the Numbers Actually Mean
Not every VIX reading means the same thing. Here is a clear guide to what each zone signals.
VIX 0–15: Calm Waters
A VIX below 15 usually indicates optimism in the market and very low expected volatility. Investors are confident. Protection is cheap. Markets tend to grind steadily higher in these conditions.
The VIX hit its all-time low of 9.14 in November 2017 — a sign of extreme calm that preceded a sharp volatility spike just months later.
VIX 15–25: Moderate Turbulence
This is where the VIX spends most of its time in normal market conditions. A reading in this range is indicative of a normal market environment — some uncertainty, but nothing extreme. As of May 2026, the VIX closed at 16.70 on May 22, sitting in this zone after a wild first quarter.
The VIX’s all-time median value is 17.62, which puts the current reading close to historical averages.
VIX 25–30: Rising Stress
When the VIX climbs above 25, market turbulence is increasing and investor confidence is fading. Expect wider daily swings in the S&P 500, more headline-driven reactions, and growing demand for defensive positions.
VIX 30 and Above: Serious Fear
A VIX above 30 typically signals anticipation of extreme swings in the market. This reading has historically coincided with market crashes, crises, and major geopolitical shocks.
In 2026, the VIX surpassed 30 for the first time since April 2025’s Liberation Day tariffs. The index hit an intraday high of 35.30 on March 9, 2026, as the U.S.-Iran conflict escalated and oil prices spiked sharply. That reading marked the 52-week high for the index.
The all-time record for the VIX was 82.69, reached in March 2020 during the COVID-19 pandemic crash.
What Has the VIX Done in 2026? Latest Analysis
Volatility has surged since the start of 2026, with the VIX topping 30 for the first time since April 2025’s tariffs as global markets faced escalating geopolitical friction.
Before 2026, the pre-crisis mental model put the VIX “normal” zone at approximately 12 to 18. After the March Iran conflict, the spot index reset higher and now anchors between 16 and 22 on quiet days. According to Trading Economics, the VIX averaged 16.89 in April 2026. That floor sits roughly four points above the 2024 calm-market average.
The practical effect: option premium across S&P 500 and Nasdaq 100 chains is structurally more expensive today than it was a year ago. Hedges cost more. But income-generating strategies also pay more for sellers of volatility.
Moves made by political leaders and within leading industries have directly impacted the VIX, making it an even more important tool for traders in 2026. Trade tariffs, the U.S.-Iran conflict, energy supply concerns, and Federal Reserve policy uncertainty have all left their fingerprints on the VIX this year.
Why Does a Rising VIX Move Prices Across Asset Classes?
The VIX does not just shake the stock market. When it spikes, it creates ripple effects across a wide range of assets.
Stocks Take the Hardest Hit
A rising VIX usually signals institutional selling. Large funds reduce equity exposure as volatility rises to avoid the compounding effect of big drawdowns on their portfolios. Technology and growth stocks feel this most acutely.
Bonds Often Rally
When fear rises, money moves from stocks into safe-haven assets. U.S. Treasury bonds typically benefit from a VIX spike, as investors treat them as the safest place to park capital.
Commodities and Oil React Differently
During geopolitical-driven VIX spikes like the one in early 2026, oil prices can surge alongside fear — rather than fall. That creates an unusual environment where both the VIX and energy prices climb together, squeezing corporate margins and consumer budgets at the same time.
Credit Markets Feel the Pressure
The VIX-induced risk-off sentiment bleeds into the credit markets, tightening financial conditions for companies with floating-rate debt. Small-cap companies in the Russell 2000 index are particularly exposed to this pressure.
Currency and Gold Markets React
Safe-haven currencies like the Japanese yen and Swiss franc tend to strengthen when the VIX rises sharply. Gold also typically benefits from a surge in market fear.
Can You Invest in the VIX?
Here is a question most new investors ask: can I buy the VIX?
Investors cannot buy the VIX directly. It is an index, not a stock or fund.
However, you can gain exposure to volatility through several instruments. VIX futures were introduced in 2004 on the Cboe Futures Exchange. VIX options were added in 2006. Exchange-traded products like VXX, UVXY, and SVXY allow retail traders to take positions on volatility without trading futures directly.
There is an important catch: products like VXX hold rolling VIX futures, which usually trade above spot VIX due to a market condition called contango. The daily roll cost of holding these products continuously eats into returns. Short-volatility products like SVXY can earn steady income in calm markets but face asymmetric risk — a single spike can erase months of gains in hours, as happened in the 2018 Volmageddon event.
The practical advice from experienced traders: treat the VIX as a temperature gauge, not a trading instrument in itself. Use spikes above 30 as a cue to rebalance into quality equities, not to pile into volatility products.
How Everyday Investors Can Use the VIX Today
You do not need to trade options or futures to put the VIX to work for you. Here are practical, grounded ways any investor can use it right now.
Use It as a Sentiment Check
Before you make any major portfolio move, check the VIX. A rising VIX tells you the market is nervous. That may not be the moment to add maximum risk. A falling VIX from elevated levels can signal that the worst fear has passed and that a recovery window may be opening.
Investors can use the VIX to help understand and anticipate potential price fluctuations in the stock market over the next 30 days. One way to do this is by looking for trend reversals — such as the VIX coming down from recent highs — which can point toward recovering confidence.
Look for Buying Opportunities in Fear
History shows that the best buying opportunities often come when the VIX is highest. When the VIX hit 82.69 in March 2020, markets were near their COVID crash lows. Investors who bought that fear and held on saw massive returns. Spikes above 30 have historically offered patient investors strong entry points for long-term equity positions.
Size Down Before High-Risk Events
When the VIX is elevated or trending higher, reduce your position size going into known market-moving events — earnings, Fed decisions, geopolitical updates. You can always add back exposure after the event clears.
Use It to Time Hedging Costs
Hedging your portfolio is cheap when the VIX is low and expensive when it is high. If you plan to buy portfolio insurance, doing it while the VIX is below 15 — rather than after it has spiked above 25 — costs significantly less and gives you better protection.
VIX-related products typically increase in value during volatile periods, which is why keeping such investments to a small portion of your portfolio — usually around 2–5% — is a sensible approach for most individual investors.
Prediction: What Does the VIX Signal for the Months Ahead?
The current VIX floor of 16–22 on normal trading days reflects a structurally more uncertain market than in 2024. The combination of ongoing geopolitical risk from the Middle East conflict, elevated oil prices near $100 per barrel, a new Federal Reserve chairman navigating near-19-year-high long-term bond yields, and a historically weak seasonal period for stocks heading into June all suggest the VIX is unlikely to fall back below 13 in the near term.
According to historical data from the Stock Trader’s Almanac, June is the worst month for major averages in midterm election years. That seasonal headwind, combined with the reset in the market’s “normal” VIX range, points to continued episodes of elevated fear volatility through summer 2026.
That does not mean disaster. Strong corporate earnings, AI investment returns, and a resilient consumer provide an important fundamental floor. But it does mean that volatility is a feature of this market, not a bug.
Final Thoughts
Understanding the VIX gives every investor a genuine edge. It tells you how scared or confident the market is, how much insurance costs right now, and what kind of risk environment you are operating in.
You do not have to trade volatility to use this tool. Watch it. Respect it. And when it spikes above 30, do not panic — that is often when the most valuable buying opportunities appear for patient, informed investors.
The VIX is not a prediction of doom. It is a temperature gauge for financial markets — and now you know how to read it.
The VIX, or Cboe Volatility Index, is a real-time measure of how much volatility investors expect in the U.S. stock market over the next 30 days. It is calculated using the prices of options on the S&P 500 index. A high VIX means traders expect big price swings ahead. A low VIX means traders feel calm and confident. It is commonly called Wall Street’s ‘fear gauge’ because it tends to rise when markets fall and fall when markets rise.
Historically, a VIX between 15 and 20 is considered normal and reflects a moderate level of market uncertainty. A VIX below 15 signals a calm, confident market. A VIX above 25 signals rising stress, and a reading above 30 signals serious fear and the expectation of extreme price swings. The all-time median value of the VIX is 17.62, and the record high is 82.69, set during the COVID-19 crash in March 2020.
The VIX rises when investors rush to buy protective options, particularly put options, against a falling market. When stock prices drop sharply, demand for that protection increases, which pushes option premiums higher and drives the VIX up. When the market rises and investors feel safe, fewer people buy protection, premiums fall, and the VIX drops. This inverse relationship is structural, not coincidental — it is built into how the VIX is calculated from S&P 500 options prices.
No. The VIX is an index, not a stock or fund, so you cannot buy it directly. However, you can gain exposure to volatility through VIX futures (introduced in 2004), VIX options (introduced in 2006), and exchange-traded products like VXX, UVXY, and SVXY. Important warning: most of these products lose value over time due to a market effect called contango, which makes them better suited for short-term hedging than long-term holding.
During the COVID-19 market crash in March 2020, the VIX hit its all-time record high of 82.69. That reading reflected extreme panic and the expectation of massive daily price swings in the S&P 500. For context, the VIX’s all-time low of 9.14 was recorded in November 2017, a period of historic market calm. The range between those two extremes shows how dramatically fear and confidence can swing.
The VIX was created by the Chicago Board Options Exchange (now Cboe Global Markets) and launched on January 19, 1993. The original methodology was developed by Professor Robert Whaley of Duke University. In 2003, Cboe partnered with Goldman Sachs to update the formula to use S&P 500 options instead of S&P 100 options, making it much more representative of the broad market. That updated version is what traders use today.
Everyday investors can use the VIX as a market sentiment check before making major portfolio moves. A rising VIX signals growing fear and suggests reducing risk exposure or avoiding new purchases until the fear peaks. A falling VIX from elevated levels can indicate recovering confidence and a potential buying window. Historical data shows that VIX spikes above 30 have often been among the best long-term buying opportunities for patient investors willing to hold through near-term turbulence.