Every serious trader checks one number before anything else at the start of a trading week. That number is the VIX — and right now, VIX and market volatility point to the most likely trading setup this week in a way that deserves your full attention. After a wild ride that saw the fear gauge rocket from 14 in December 2025 all the way above 52 in April 2025 and spike again into the 30s in early 2026, the VIX has cooled sharply. As of May 22, 2026, it closed at 16.70 — well below the levels that signal heightened anxiety — with a 52-week range spanning from 13.38 to 35.30. Today, we break down exactly what that means, why it matters, and what trading setups the current volatility environment is pointing toward this week.
What Is the VIX and Why Does It Drive Trading Decisions?
The CBOE Volatility Index (VIX) is a real-time measure of expected volatility in the S&P 500 over the next 30 days. It is calculated by the Chicago Board Options Exchange using a weighted average of S&P 500 option prices. Simply put, it tells you how much investors are paying to protect themselves against large market swings.
The VIX is not a prediction of where the market will go. It is a measure of how uncertain the market is about where things are heading.
When the VIX is low, investors feel relatively safe. They are not paying much for protection, which means they are not worried about big price swings. When it surges, fear is spreading — investors are rushing to buy options insurance, and the cost of that insurance rises.
Most traders use three broad VIX zones to frame their approach:
Below 15 — Calm and potentially complacent. Low volatility environments often favor slow-moving, trend-following trades. But they can also be a warning that markets are pricing in too much optimism before a sharp correction.
15 to 25 — The normal anxiety range. Some uncertainty exists but the market is functioning. This is where the VIX spends most of its time outside of crisis periods.
Above 25 — Elevated fear. Investors are pricing in larger-than-normal swings. Above 30 signals significant stress. Above 40 marks true crisis conditions.
As of this week, the VIX sits at 16.70 — in the transition zone between calm and moderate anxiety. That positioning is loaded with information for traders who know how to read it.
The VIX’s Volatile Journey to Where It Stands Today
To understand this week’s setup, you need to know where the VIX has been — because context is everything.
April 2025: Liberation Day and the Spike to 52
The year 2025 began with the VIX sitting near historically low levels, reflecting investor confidence heading into the year. Then came April 8, 2025 — the day President Trump announced sweeping “Liberation Day” tariffs. The VIX spiked to a peak of 52.33, its highest end-of-day level since April 2020. In three trading days between April 4 and April 7, the VIX surged 118% — the fifth-largest three-day spike on record going back to 2014. It was a genuine crisis signal.
Then, as trade tensions eased and markets stabilized, the VIX collapsed just as fast as it rose. By December 2025, it had fallen back to 14 — its lowest level of the year — as the S&P 500 hit its 38th record high of the year.
Early 2026: Volatility Returns with New Threats
January and February 2026 brought a fresh wave of volatility. A combination of technology sector repricing, new tariff concerns, and political uncertainty pushed the VIX back up to 21 to 22 by late February 2026 — a 42% spike year-to-date at that point.
Then came March 2026, when global trade tensions escalated again and the VIX climbed back above 30 for the first time since the April 2025 tariff shock. Geopolitical risk and policy uncertainty drove that spike.
But here is the critical part: the spike did not last. By mid-April 2026, the VIX dropped back below 20 — the level that most traders consider the start of heightened market anxiety. And by late May 2026, it has compressed further to the 16 to 17 zone, where it sits right now.
That drop from above 30 to below 17 in roughly six to eight weeks is the structural backdrop for everything happening in markets this week.
VIX and Market Volatility Point to the Most Likely Trading Setup This Week
The current VIX level of ~16.70, combined with the broader market backdrop, creates a specific set of conditions that make certain trades more likely to work than others this week. Here is the analysis.
The Compression Setup: Low VIX After a High-Volatility Spike
When the VIX falls sharply from a spike — particularly one as dramatic as the move from above 30 down to 16 — it typically signals one of two things: either fear has genuinely left the market and the calm will persist, or volatility is compressing into a coil that will spring again when the next catalyst hits.
Right now, both scenarios are plausible. The S&P 500 has been recovering, with Q1 2026 earnings coming in strong — 74% of the 472 companies that have reported beat on revenue, and 82% beat on earnings per share, with EPS growth tracking at 27.49%. That is real fundamental support.
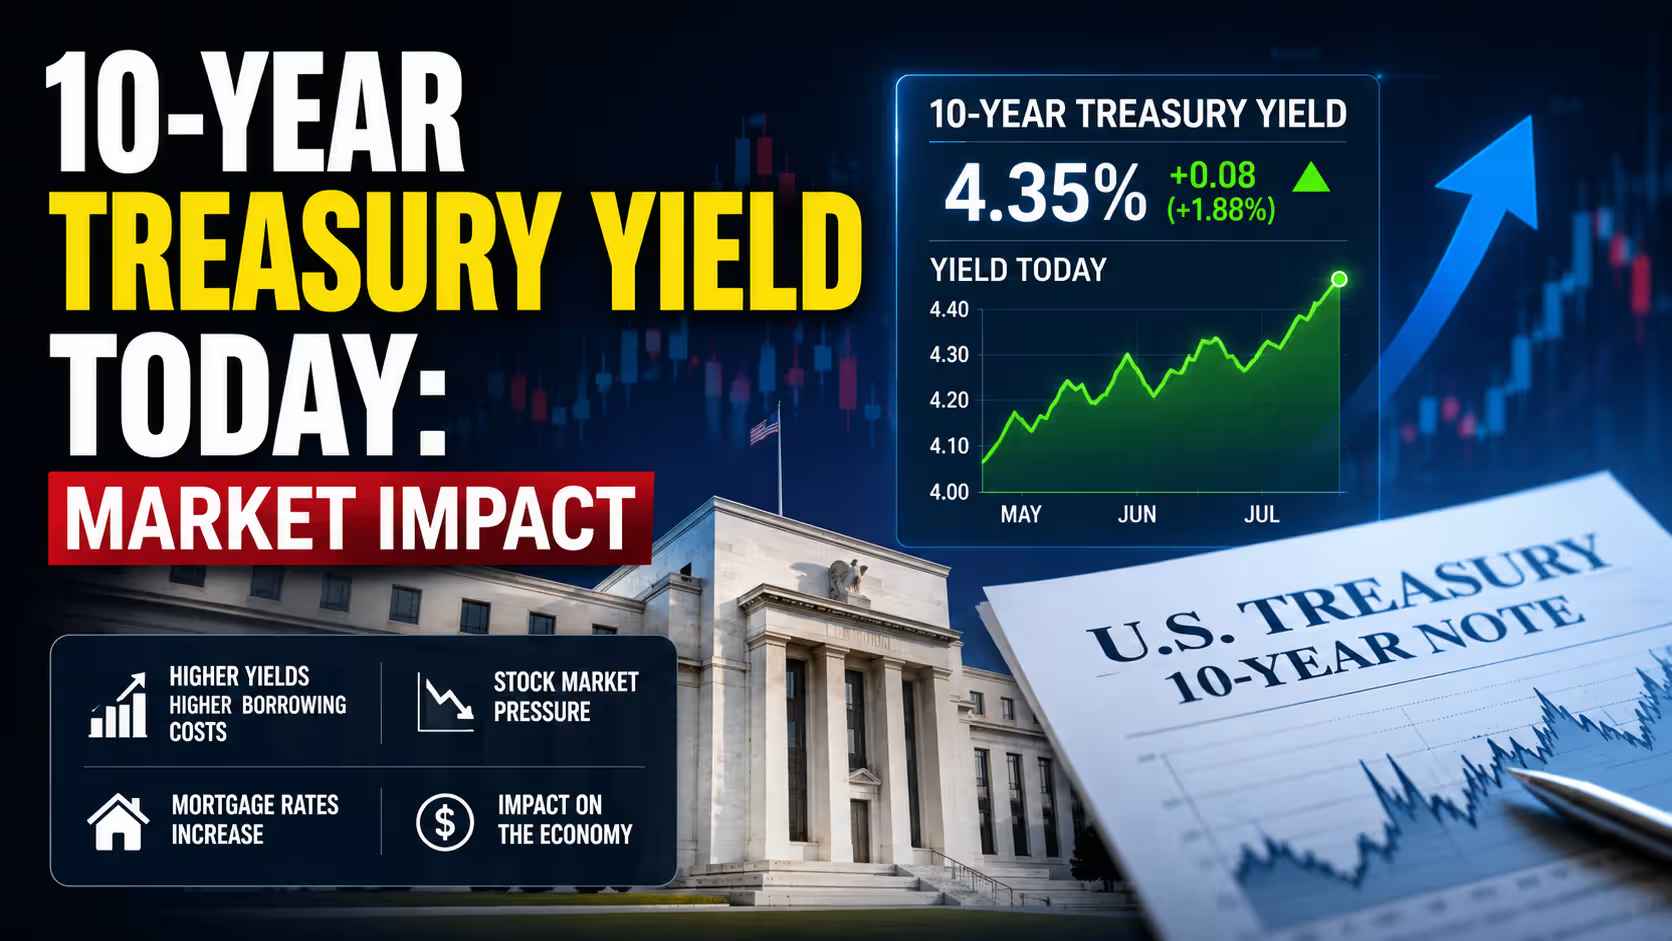
But the macro backdrop has not disappeared. The 10-year Treasury yield moved decisively above 4.50% in the week of May 17, triggering a global bond market selloff and equity de-risking on Friday. That bond yield pressure compresses the equity risk premium and challenges stretched valuations — particularly in growth and technology sectors where positioning remains concentrated.
The most likely near-term trading setup points to continued equity resilience in the short term, but with elevated tail risk if Treasury yields push higher or geopolitical headlines resurface. Think: trade the range carefully, not the breakout aggressively.
The Three Specific Setups Traders Are Watching This Week
Setup 1: The VIX Mean-Reversion Trade (Volatility Sellers)
With the VIX at 16.70 and in a clear downtrend from its March highs, many professional traders are positioned for continued volatility compression. Several traders on live market platforms are watching the VIX for a push toward the 15 zone — a target that some analysts consider achievable if equities continue to grind higher through the Memorial Day holiday period and into the following week.
The trade here is selling volatility — via covered calls on long equity positions, selling options premium on the S&P 500, or using VIX instruments to express a “fear stays low” view. The VIX’s 20-day EMA continues to slope downward, confirming the trend.
The key risk: a new macro shock — another tariff escalation, a Federal Reserve surprise, or a geopolitical event — can send the VIX back above 20 in hours. Traders executing volatility-selling setups this week are doing so with tight stops around the 18 to 19 zone on the VIX.
Setup 2: The Rate-Sensitive Rotation Trade
The most important driver of near-term market direction is not the VIX itself — it is Treasury yields. The week of May 17 showed exactly how sensitive the equity market has become to the 10-year yield moving above 4.50%. When yields rise, growth and tech stocks face pressure. When they stabilize or fall, they bounce.
The rotation trade involves shifting from high-multiple technology holdings toward dividend-paying, rate-insensitive sectors — financials, energy, industrials, and healthcare — while the bond market works through its selloff. The Dow Jones Industrial Average and S&P 500 Equal Weight index both hit fresh all-time highs in the week ending May 22, even as the Nasdaq lagged. That breadth signal tells traders that the rotation away from concentrated tech into the broader market is the path of least resistance.
This setup favors value over growth, equal-weight indices over cap-weighted ones, and defensive dividend payers over high-duration tech.
Setup 3: The Volatility Expansion Trade (The Contrarian Watch)
Here is the trade most retail investors miss. Historically, when the VIX has spiked more than 100% in three days and then mean-reverted sharply — as it did after April 2025 — the average one-year return for the S&P 500 has been about 4.4%, and the average five-year return has been 10.2%. “High volatility and fear equal opportunity,” as one well-known market strategist put it on X (formerly Twitter) in April 2025.
The contrarian setup this week is not for the faint-hearted. If the VIX fails to hold below 18 — if it closes convincingly back above that level — it signals that volatility is re-expanding rather than continuing to compress. That would be a warning for equity bulls and a signal to reduce risk or add tail-risk hedges through VIX call options, put spreads on the S&P 500, or by raising cash.
The level to watch: a VIX close above 19 would break the current downtrend and force a reassessment of the low-volatility narrative.
What the Current VIX Level Means for Different Types of Traders
For Day Traders
A VIX at 16 to 17 means intraday ranges are tighter than they were in March. The market is not giving you the wild intraday swings of a 30+ VIX environment. Day traders need to size trades appropriately — expecting smaller average moves and resisting the temptation to over-leverage because the market “looks calm.”
Watch for intraday VIX spikes above 18 as a signal that institutional hedging is picking up and equities may be setting up for a reversal.
For Swing Traders
This is the most favorable environment right now. A VIX between 15 and 20 with a clear downtrend in place, combined with strong earnings and breadth expansion, is a swing trader’s setup. The strategy is buying pullbacks in quality names with strong earnings — particularly in the industrials, healthcare, and financial sectors leading the broad market higher — with defined risk to the prior swing low.
Avoid chasing high-multiple tech names where the rate sensitivity is highest. Focus on sectors benefiting from the rotation trade.
For Long-Term Investors
The message from the current VIX is straightforward: fear has retreated dramatically from the highs, but the fundamental risks — Treasury yields, geopolitical tensions, and stretched tech valuations — have not fully resolved. Use periods of low VIX to rebalance your portfolio toward your target allocation. If the tariff-driven spike taught investors one thing, it is that the road from VIX 14 to VIX 52 can take less than two months.
Do not let a low VIX lull you into complacency.
The Key Market Events That Could Move the VIX This Week
Several catalysts have the potential to push the VIX sharply in either direction in the week starting May 26, 2026.
Geopolitical headlines remain the top wildcard. The Iran situation — where the U.S. Secretary of State indicated “a little bit of movement” toward a peace deal — has the potential to sharply reduce oil prices and relieve one source of yield pressure. A surprise escalation would do the opposite.
Treasury yield movements are the single most important macro driver right now. The market commentary for the week of May 17 made clear that when the 10-year moved decisively above 4.50%, equities sold off sharply. Watch the 10-year daily close — above 4.60% likely triggers another VIX pop; below 4.40% likely pushes it toward the 15 zone.
Federal Reserve communications continue to matter. Any language suggesting rate hikes are back on the table — rather than cuts later in the year — would compress the equity risk premium and likely send the VIX back above 20 rapidly.
Earnings reports from remaining S&P 500 companies could deliver further upside or downside surprises. With 82% beat rates so far, expectations are high. A meaningful miss from a major company could catalyze selling in a market where positioning is already stretched.
Bottom Line: Use the VIX as a Live Thermometer, Not a Crystal Ball
The VIX does not tell you which direction the market will go next week. What it tells you — with remarkable precision — is how much uncertainty the market is pricing in right now and how that compares to recent history.
Right now, at 16.70, the VIX is saying: fear has left the building, at least temporarily. The most likely trading setup this week is one of cautious optimism — equities grinding modestly higher, Treasury yields remaining the key swing factor, and the VIX hovering in the 15 to 18 zone barring a new macro shock.
The VIX’s 52-week range of 13.38 to 35.30 tells the full story of what this market has been through. It has survived a tariff shock to 52, multiple volatility spikes, and a bond market selloff — and it is still making new highs in breadth. That is resilience. But resilience is not invincibility. The traders who perform best this week will be the ones who respect both the opportunity the current low VIX creates and the risks still lurking underneath the surface.
Check the VIX every morning before you place a trade. This week, it is one of the most important inputs you have.
The VIX (CBOE Volatility Index) is a real-time measure of the market’s expectation of volatility in the S&P 500 over the next 30 days. It is calculated by the Chicago Board Options Exchange using a weighted average of S&P 500 option prices. When the VIX is low (below 15), investors feel relatively calm and are not paying much for protection against market swings. When it is high (above 25-30), fear is elevated and investors are rushing to buy options insurance. It is often called the ‘fear gauge’ because it rises sharply during market selloffs and crisis events. As of May 22, 2026, the VIX closed at 16.70, with a 52-week range of 13.38 to 35.30.
The VIX hit a peak of 52.33 on April 8, 2025 — its highest end-of-day level since April 2020 — after President Trump announced sweeping ‘Liberation Day’ tariffs that triggered a global market selloff. Between April 4 and April 7, 2025, the VIX surged 118% in three days, the fifth-largest three-day spike since 2014. It then collapsed back toward 14 by December 2025 before rising again to above 30 in March 2026 on fresh tariff and geopolitical concerns, before falling back to around 16 to 17 by late May 2026.
A VIX of 16 to 17 sits in the normal-to-moderate anxiety range and signals that fear has retreated significantly from earlier 2026 highs. For traders, it means intraday price ranges are tighter than in high-VIX environments, making it less ideal for day trading high volatility but well suited for swing trading quality pullbacks in leading sectors. It also means options premiums are cheaper — a good time to buy protective puts as insurance or to sell covered calls for income. The key risk is that a VIX at 16 to 17 is vulnerable to a fast reversal if a new macro catalyst emerges — Treasury yields rising above 4.60%, a geopolitical shock, or a Federal Reserve hawkish surprise could push it back above 20 quickly.
Historically, a major VIX spike has been a bullish long-term signal for stocks — even though it feels terrifying in the moment. Research from Creative Planning’s chief market strategist found that after three-day VIX spikes ranging from 63% to 176% since 2014, the average one-year S&P 500 return was about 4.4%, and the average five-year return was 10.2%. The April 2025 spike to 52.33 followed this pattern — buyers emerged quickly, and markets recovered sharply. The principle is that extreme fear creates extreme opportunity for investors with long time horizons who can resist the urge to sell at the bottom.
The most important VIX level to watch this week is 18 to 19. The VIX is currently in a clear downtrend below 18, with multiple traders on live platforms noting intraday resistance near 18 and support around 17 to 17.30. If the VIX closes convincingly above 19, it would break the current downtrend and signal that volatility is re-expanding — a warning for equity bulls. On the downside, a sustained break below 16 toward the 15 zone would confirm continued volatility compression and support further equity gains. Treasury yield movements (watch the 10-year versus the 4.50% level) are the primary catalyst that could force the VIX to break in either direction.
Traders cannot buy or sell the VIX index directly, but they can trade it through several instruments. VIX futures allow traders to take long or short positions on expected future volatility. VIX options let traders buy calls (betting volatility rises) or puts (betting it falls). VIX ETPs and ETNs — such as UVXY (2x leveraged long volatility) and SVXY (short volatility) — allow both retail and institutional traders to express volatility views without using futures accounts. Many traders also use S&P 500 put options as a proxy for volatility exposure. It is important to note that VIX ETPs decay over time due to futures roll costs — they are designed for short-term tactical use, not long-term holding.
The VIX spikes quickly because fear moves faster than greed. When uncertainty hits — a tariff announcement, a geopolitical event, a Fed surprise — institutional investors and hedge funds rush simultaneously to buy S&P 500 put options as protection. That sudden surge in demand for protective options drives up their prices dramatically, which in turn drives the VIX sharply higher. The April 2025 three-day spike of 118% is a perfect example. Conversely, the VIX tends to fall slowly and grind lower as fear fades over weeks or months. This asymmetry — fast spikes, slow declines — is why the VIX is said to ‘take the stairs up and the elevator down’ in reverse: it takes the elevator up and the stairs down.