Here Are the 5 Levels Every Investor Needs to Watch This Week
S&P 500 futures are flashing a warning heading into the week of May 19–23, 2026 — and the signals are coming from multiple directions at once. Treasury yields just hit their highest levels in over a year. Oil crossed $110 a barrel. The S&P 500 posted three straight losing sessions to start the week. And the most important earnings report of the quarter — Nvidia — hits Wednesday after the close. This is not a week for investors to look away. Below, we break down exactly what is happening, why it matters, and the five specific price levels every investor needs to watch right now.
What Is Sending S&P 500 Futures a Warning Signal Right Now?
Before we get to the specific numbers, it helps to understand what is actually driving the warning.
Three major forces are colliding at the same time this week, and together they are creating a level of uncertainty that few weeks in 2026 have matched.
Rising Treasury Yields Are Pressuring Stocks
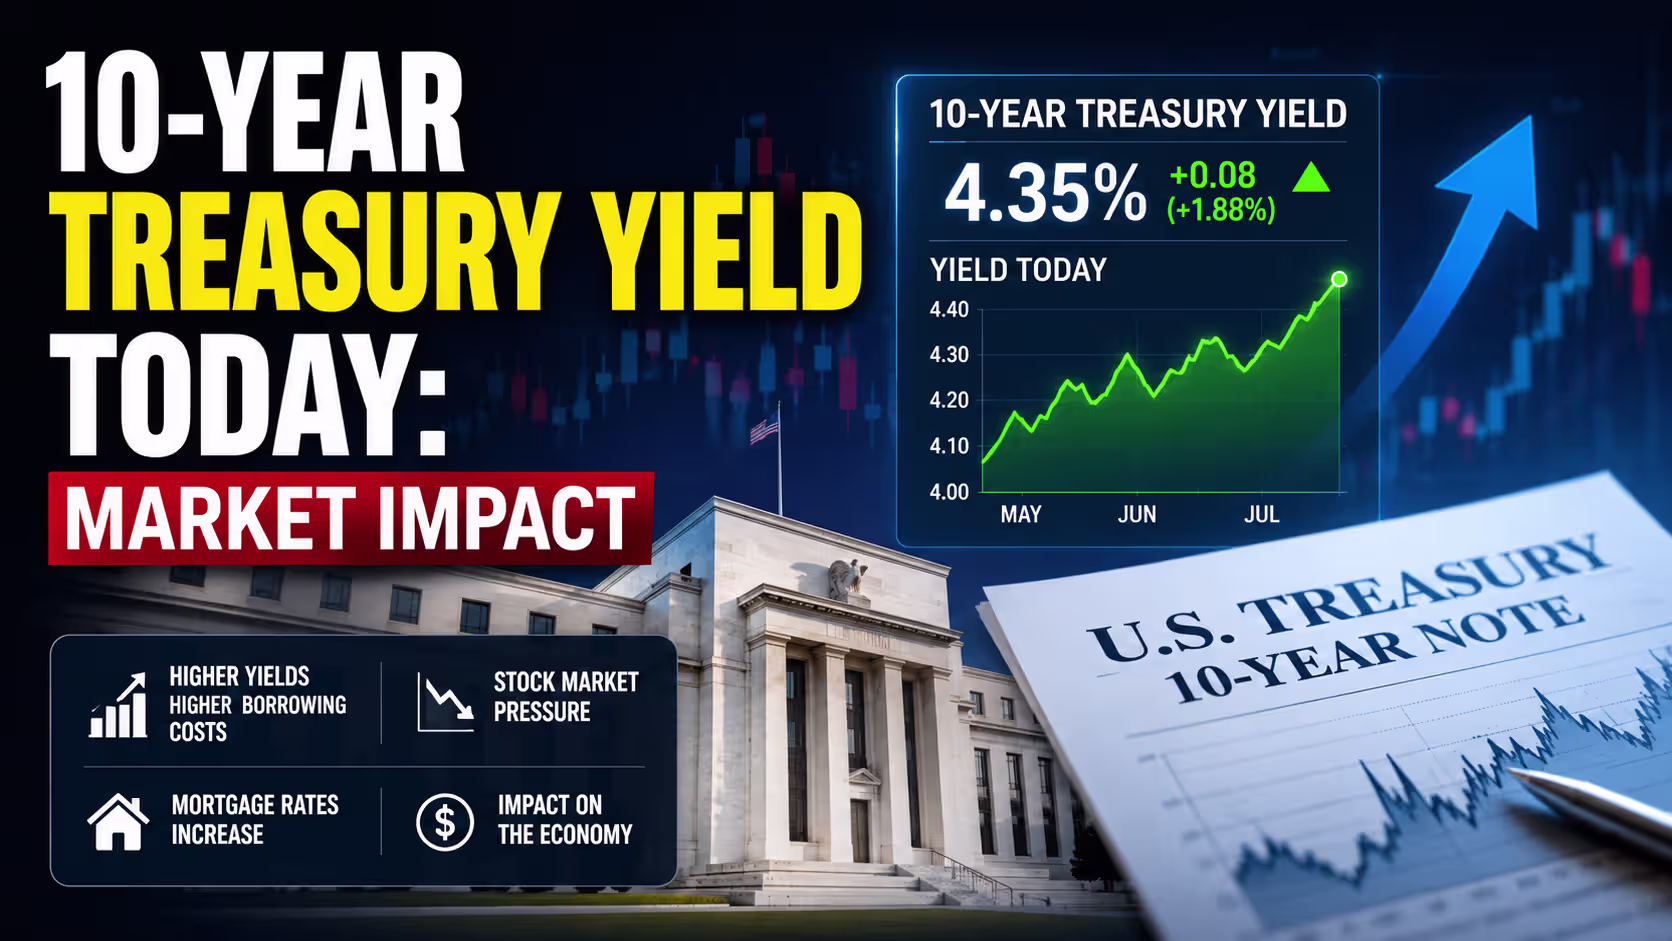
The 10-year U.S. Treasury yield climbed above 4.6% on Monday, May 18 — hitting its highest level since February 2025. The 30-year Treasury yield touched 5.197% on Tuesday, its highest in over a year.
That matters enormously for stocks. Morgan Stanley’s Michael Wilson has flagged 4.5% on the 10-year as the threshold beyond which yields start seriously pressuring equity valuations. We are above that level right now.
When bonds pay more, investors have less reason to take on the extra risk of stocks. Rate-sensitive sectors — technology, real estate, homebuilders — feel the pressure first and hardest. The iShares U.S. Home Construction ETF (ITB) dropped more than 1% as homebuilders like D.R. Horton, Lennar, and Toll Brothers sold off alongside the yield move.
The driver behind these rising yields is not a mystery: the Iran conflict is keeping oil prices elevated, and elevated oil feeds directly into inflation. Bank of America analysts have warned that the Federal Reserve may need to delay rate cuts until the second half of 2027 due to persistent inflationary pressure — far later than markets had been pricing in.
Oil Above $110 Is the Inflation Engine
Brent crude topped $110 per barrel this week before pulling back slightly after President Trump said he was postponing a planned military operation against Iran to allow negotiations to continue. WTI crude sat near $104 per barrel as of Tuesday.
At these prices, energy costs are rising across the entire economy — from transportation and shipping to food production and manufacturing. The inflation reading for April, due later this week, is widely expected to reflect oil-driven pressure.
Goldman Sachs has already noted that a sustained spike in oil to $120 per barrel could add 1.7% to U.S. headline CPI. We are not far from that level.
Nvidia Earnings Could Move Everything on Wednesday
Wednesday afternoon, Nvidia — the world’s most important AI chip company — reports its first-quarter earnings. Wall Street analysts expect a 79% revenue jump year-over-year. Options markets suggest the stock could move approximately 5.5% in either direction after the report, according to Bloomberg data.
Nvidia is not just a stock. It is the single most influential company in the S&P 500 right now, and its result will set the tone for how markets interpret the entire AI spending cycle heading into the second half of 2026. A strong print could lift the Nasdaq and the broader S&P 500. A miss or cautious guidance could extend the current losing streak and break through the key support levels outlined below.
S&P 500 Futures Flash a Warning: The 5 Key Levels to Watch This Week
Here are the five price levels that professional traders and market strategists are watching most closely this week. Understanding these levels helps you know whether the market is holding together or starting to crack.
Level 1 — 7,400: The Immediate Battleground
The S&P 500 closed at 7,353 on Tuesday, May 19, barely clinging to the 7,400 area as a reference point. The index has been fighting to hold this zone since last week’s Friday close of 7,408.50, which represented the largest single-day decline since March.
The 7,400 region is significant because it acts as a near-term pivot. As long as the S&P 500 trades in this zone, the market is in a state of tension rather than breakdown. A decisive close back above 7,420–7,450 would signal that buyers are willing to defend the index ahead of Nvidia earnings. A close below 7,350 would signal that sellers are winning the short-term argument.
Watch this level on Wednesday before and after the Nvidia announcement.
Level 2 — 7,362 to 7,372: Near-Term Support That Must Hold
Traders watching the ES futures contract (the S&P 500 futures ticker) are closely monitoring the 7,362–7,372 zone. This is an active support area derived from the four-hour chart structure.
If the index falls through 7,400 and enters this range, it becomes a decision point. A bounce here would suggest that buyers are still engaged at lower prices and that the pullback is a healthy correction within a larger uptrend. A failure to hold 7,362 opens the door to a faster move toward the next major level below.
This zone is especially important on the days surrounding Nvidia earnings — Thursday and Friday could see significant directional movement depending on how the market digests the result.
Level 3 — 7,200: The Bull/Bear Line in the Sand
Institutional analysis published this week identifies 7,200 as the critical dividing line between bullish and bearish near-term momentum.
Above 7,200, the structural argument for continued recovery from the March 2026 lows remains intact. Analysts note that as long as price holds above this level, trend-following models stay in a long (bullish) posture.
A sustained break below 7,200 would shift momentum decisively toward a bearish correction and likely open the next support cluster around 7,163 to 7,112.
Strategist Adam Crisafulli of Vital Knowledge has warned that if the Iran conflict leads to a prolonged closure of the Strait of Hormuz and oil sustains above $120, the S&P 500 could test the 6,000 level — meaning 7,200 is the first real line of defense before a much larger drop becomes the central conversation.
Level 4 — 7,000: The Medium-Term Safety Net
Technical analysis from Investtech identifies 7,000 as the primary medium-term support zone for the S&P 500 in case of a deeper negative reaction.
The index previously broke out of a horizontal trend channel to the upside, and 7,000 now represents where that channel’s upper boundary sits — typically a key support on any pullback after a breakout.
If yields keep rising and the Iran situation does not de-escalate, 7,000 is where longer-term technical buyers are likely to step in more aggressively. A move to 7,000 would represent roughly a 5.4% decline from current levels and would bring the index close to its 200-day moving average.
This is the level that long-term, buy-and-hold investors should have marked on their charts as the critical test for the broader trend.
Level 5 — 5,767 (52-Week Low): The Worst-Case Scenario Reference
The S&P 500’s 52-week low stands at 5,767.41, set in early 2026 during the deepest part of the Iran-conflict-driven selloff and tariff-related market stress. The 52-week high is 7,517.12.
This level is not expected by most analysts under current conditions, but keeping it visible helps investors understand the full range of risk on the table. From the current level near 7,400, a return to the 52-week low would represent a decline of approximately 22% — enough to be classified as a new bear market.
Most institutional forecasts do not put this as a base case. But with oil above $110, Treasury yields at year-long highs, and geopolitical uncertainty still elevated, understanding the full risk range is a hallmark of informed investing — not pessimism.
The Week’s Other Market Movers to Track
Retail Earnings: Target and Walmart in Focus
Two of America’s biggest consumer barometers — Target (TGT) on Wednesday and Walmart (WMT) on Thursday — report earnings this week. Persistent inflation, elevated interest rates, and geopolitical uncertainty may weaken consumer confidence. If consumer spending is beginning to slow, these results will show it.
Consumer spending has been one of the strongest pillars supporting the U.S. economy over the past two years. Any cracks here would add to the pressure already building in the broader market.
Fed Minutes on Wednesday
The Federal Reserve releases the minutes from its April meeting on Wednesday. Market participants are watching closely for signs of how divided policymakers are on the question of rate adjustments.
With the 10-year yield already above 4.6% and inflation risks rising from oil prices, the minutes could either calm markets or deepen worry. Any language suggesting the Fed is considering rate hikes — rather than cuts — could send yields higher still and apply additional downward pressure to equities.
The Iran Wildcard
The single biggest market variable this week remains the Iran conflict. President Trump postponed a planned military strike on Tuesday, saying “serious negotiations are now taking place” and that Iran should act “FAST.” But he also said the U.S. military remains on standby for a “full, large scale assault on a moment’s notice” if a deal is not reached.
Markets have learned to trade the headline risk in real time. Any announcement of resumed strikes or a ceasefire agreement could move S&P 500 futures by 1% or more in the overnight session. Investors should watch for breaking news on this front throughout the week.
Latest Analysis: How Smart Investors Are Positioning This Week
Based on current institutional commentary and market positioning data, here is what experienced investors are doing right now.
Building cash positions for flexibility. The combination of Iran uncertainty, rising yields, and a major earnings catalyst creates a setup where having dry powder — cash ready to deploy — gives investors options whether the market breaks higher or lower.
Watching Nvidia’s guidance more than its results. A 79% revenue beat is already expected by analysts. What matters more is what CEO Jensen Huang says about the second half of 2026 and demand for AI infrastructure spending. Cautious guidance could reset expectations across the entire tech sector.
Monitoring the VIX closely. The Volatility Index (VIX) has been elevated this week but has not yet spiked to extreme fear levels. Morgan Stanley notes that yields above 4.5% combined with a rising VIX is a historically significant warning combination for near-term equity performance.
Staying selective, not panicked. Short-term traders may be reducing exposure ahead of Nvidia and the Fed minutes. Long-term investors, however, are reminded that the S&P 500 hit record highs in April 2026 just weeks after the conflict began — markets have repeatedly demonstrated resilience when core corporate earnings remain strong outside the energy sector.
FAQ
S&P 500 futures are contracts that let traders bet on where the S&P 500 index will be at a future date. They trade nearly 24 hours a day, which means they often signal how the stock market will open before U.S. exchanges begin the regular session. When futures drop overnight, it usually means the stock market will open lower. When futures rise, stocks often open higher. Investors and traders watch futures closely as an early warning system for daily market direction.
Treasury yields are rising primarily because of inflation fears driven by oil prices staying above $110 per barrel due to the Iran conflict. When oil is expensive, it raises the cost of almost everything, which keeps inflation high. Higher inflation leads investors to expect the Federal Reserve to delay rate cuts or even raise rates. When bond yields rise, bonds become more attractive compared to stocks, which puts downward pressure on stock prices — especially high-growth and rate-sensitive sectors like technology and real estate.
A support level is a price zone where buying interest has historically been strong enough to stop a stock or index from falling further. When the S&P 500 approaches a support level, many investors watch to see if it bounces or breaks through. A bounce from support suggests buyers are still in control. A break below support signals increased selling pressure and can lead to a faster decline toward the next lower level. Support levels help investors plan entry and exit points and assess how much risk they are taking at any given price.
Nvidia is one of the largest companies in the S&P 500 by market capitalization, and its stock has a significant influence on the broader index. More importantly, Nvidia’s earnings represent a key signal for the entire artificial intelligence investment theme — one of the primary drivers of the stock market rally since 2023. Wall Street analysts expect a 79% revenue jump from Nvidia this quarter. Its guidance for the rest of 2026 will heavily influence how investors view AI spending across the tech sector and the market as a whole.
When futures signal potential market weakness, everyday investors should avoid making panic-driven decisions. The most important step is reviewing your asset allocation to make sure it matches your risk tolerance and investment horizon. Long-term investors — those with five or more years ahead — have historically been rewarded for staying invested through short-term volatility. If you are closer to needing your money, reducing exposure to high-risk assets in advance of uncertainty is a reasonable precaution. Always consult a qualified financial advisor before making significant changes to your portfolio.
The VIX — formally known as the CBOE Volatility Index — measures how much volatility options traders expect from the S&P 500 over the next 30 days. It is often called the ‘fear gauge.’ A VIX above 20 generally signals elevated anxiety in the market, while a reading above 30 indicates significant fear. This week, the VIX has been elevated but has not yet reached extreme levels, which suggests the market is cautious but not panicking. Morgan Stanley flags the combination of VIX elevation plus 10-year yields above 4.5% as a historically significant warning signal for near-term equity performance.
Yes, and history from 2026 already supports this. The S&P 500 hit all-time record highs in April 2026 just weeks after the Iran conflict began and caused a sharp initial selloff. Markets have shown an ability to recover quickly when corporate earnings remain strong and investors begin to see a lower probability of broader economic disruption. The key factors for a fast recovery this week would be strong Nvidia earnings guidance, a de-escalation in Iran, or a pullback in oil prices and Treasury yields. None of these are guaranteed, but all are possible within the current week.