Global stock market updates are delivering some of the clearest warning signals investors have seen in years — and ignoring them could be costly. On May 15, 2026, the Dow Jones fell more than 537 points, the S&P 500 dropped 1.24%, and the Nasdaq slid 1.54%, as Treasury yields hit a one-year high, oil prices surged past $109 per barrel, and fears of a Federal Reserve rate hike rattled investors worldwide. This is not an ordinary pullback. Several key signals are lining up at the same time, and every serious investor needs to understand what they mean.
Global Stock Market Updates: Key Signals Investors Should Not Ignore
Markets rarely move for just one reason. What makes today’s environment different — and more demanding of attention — is the number of signals flashing at once. Treasury yields are surging globally, oil prices are near multi-year highs, inflation is re-accelerating, the VIX is climbing, and the S&P 500 just hit a record high before pulling back sharply. Each of these is a signal on its own. Together, they form a picture that smart investors cannot afford to dismiss.
Here is a clear, factual breakdown of every major signal in the market today — and what each one means for your money.
Signal 1: Treasury Yields Hitting One-Year Highs
One of the most important live market signals right now is what is happening in the bond market.
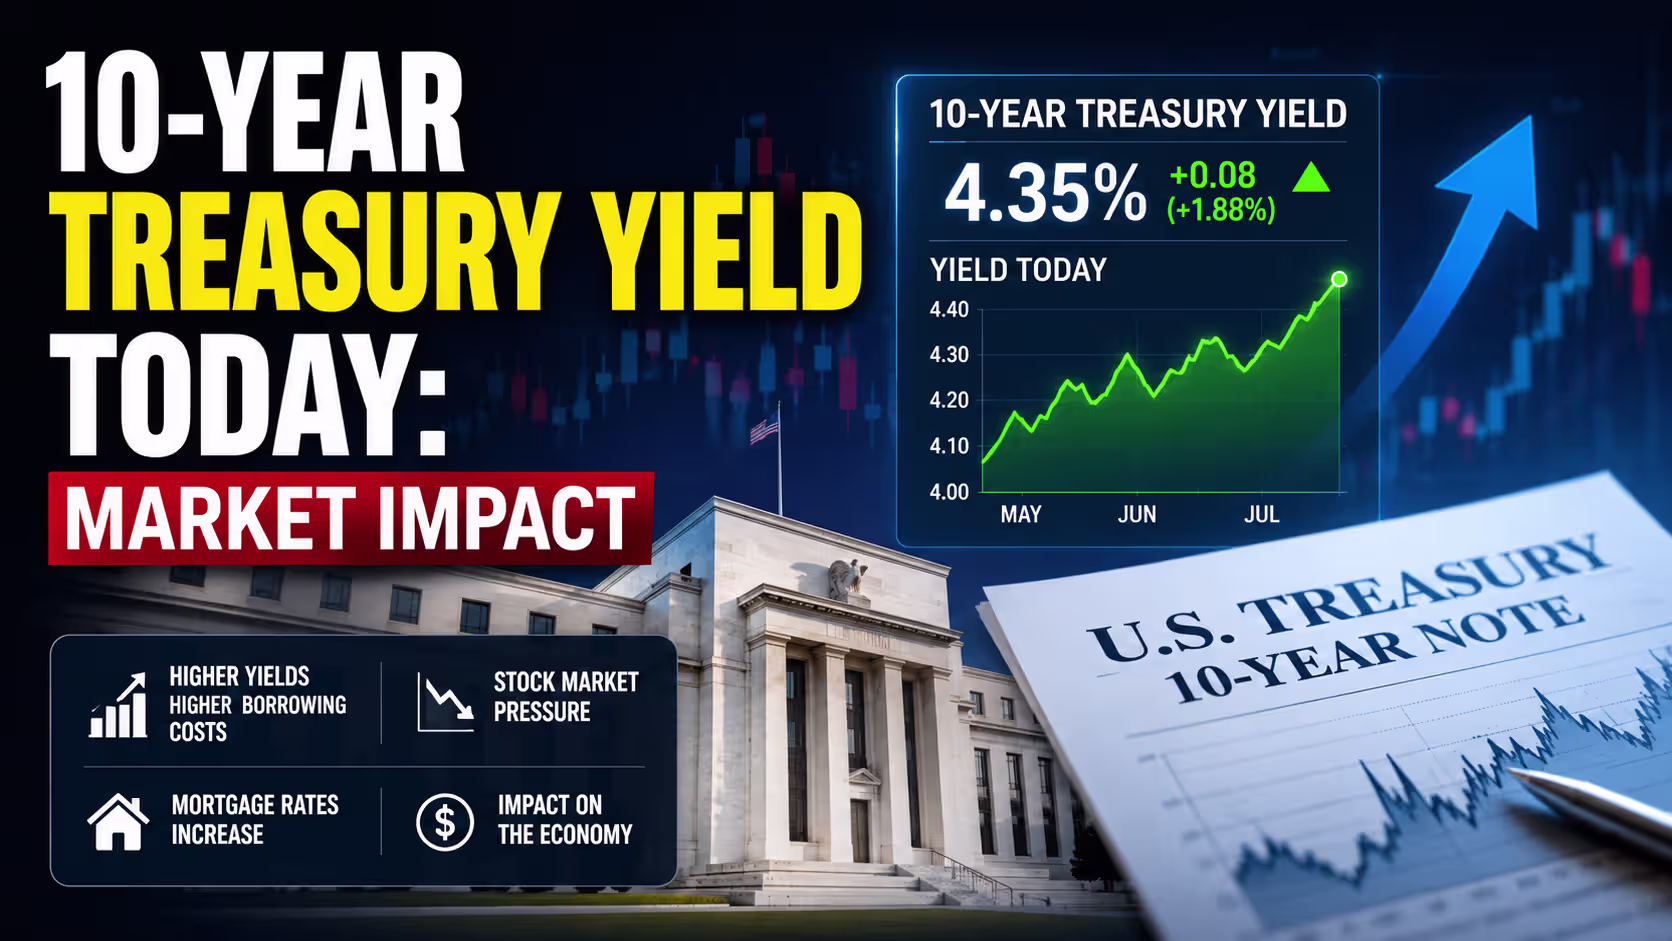
On May 15, 2026, the 10-year US Treasury yield spiked to 4.55% to 4.6% — the highest level in a year. This capped the biggest weekly jump in the 10-year yield since President Trump’s tariffs shocked markets in April 2025. The 30-year US Treasury yield is sitting near its 2023 peak.
But this is not just a US story. The bond selloff raced through global markets on the same day:
Japan’s 30-year government bond yield hit 4% for the first time since those bonds were first issued in 1999. The UK’s 30-year gilt yield reached a 28-year high. Germany, Spain, Australia, and New Zealand all saw their bond yields push higher on the same day.
Why does this matter for stock investors? Rising yields make bonds more attractive than stocks. They increase borrowing costs for companies, which squeezes profits. And they signal that markets expect inflation to stay elevated — or even worsen.
Fed Governor Michael Barr put it plainly: inflation is the overwhelming risk facing the economy right now, after producer costs accelerated at the fastest pace since 2022.
Signal 2: The VIX Is Approaching the Danger Zone
The CBOE Volatility Index — commonly called the VIX, or the fear gauge — is a number every investor should understand.
On May 15, 2026, the VIX surged more than 6.78% to 18.43, touching above 19 intraday. The traditional threshold to watch is 20. When the VIX crosses and holds above 20, it signals heightened uncertainty and often precedes sharper market swings.
Just a few weeks ago, the VIX was near its lows. The speed of this move matters. Volatility that rises quickly signals that professional traders are rapidly repricing risk — not gradually adjusting to new information, but reacting to something that caught them off guard.
The trigger this week was a combination of two hotter-than-expected inflation data points and the failure of the Trump-Xi summit to produce progress on ending the Iran conflict or reopening the Strait of Hormuz.
Investors who watch the VIX approaching 20 should treat it as a signal to review their exposure to high-risk, high-valuation assets.
Signal 3: Oil Prices and the Strait of Hormuz
Crude oil prices are one of the most powerful signals in the global economy, and they are flashing red today.
Brent crude traded near $109 per barrel on May 15, 2026, while WTI crude hovered around $104 after intraday spikes above $110. Oil prices are up nearly 80% since the start of 2026, driven primarily by the closure of the Strait of Hormuz — a critical shipping lane that carries roughly 20% of all global crude oil shipments.
Higher oil prices feed directly into inflation. They push up the cost of fuel, transport, food production, and manufacturing. That keeps inflation elevated, which reduces the chance the Fed will cut rates and raises the chance it might hike them.
The latest prediction from traders is striking: the CME FedWatch Tool showed a 45% probability of a Fed rate hike sometime in 2026 — up from just 1% a month ago. That single data point tells you how much the oil shock has shifted market expectations in a very short period of time.
The diplomatic picture is not encouraging. President Trump dismissed parts of Iran’s proposed peace conditions after his summit with President Xi, and Iran warned against external pressure. The Strait remains effectively closed, keeping energy markets on edge.
Signal 4: The S&P 500’s Narrow Rally and Stretched Valuations
The S&P 500 hit a record close above 7,500 for the first time ever on Thursday, May 14, 2026. The Dow reclaimed 50,000 on the same day. That sounds like good news — but beneath those headline numbers, some important warning signs are building.
Only about half of all stocks in the S&P 500 are currently trading above their 50-day moving average. That means the headline index is being lifted primarily by a small group of large-cap, AI-linked companies, while the rest of the market is not keeping up. Narrow rallies like this can persist for a while, but they tend to be fragile. When leadership fades, the fall is often sharper than it would be in a broad-based rally.
Valuations add to the concern. The forward 12-month price-to-earnings ratio for the S&P 500 stood at 20.9 by late April 2026 — above the five-year average of 19.9 and the ten-year average of 18.9. The market is being priced for a continuation of today’s strong earnings trajectory well into the second half of 2026. Any earnings disappointment could knock markets off balance quickly.
The S&P 500 Index currently faces a resistance area in the range of 7,450 to 7,500, with support sitting near 7,030. That is a significant gap, and it represents the potential downside if sentiment shifts.
Signal 5: AI Sector Concentration and Tech Volatility
Artificial intelligence has been the dominant market narrative for two years, and the AI trade is not over. But today’s market action shows it is becoming more selective — and more fragile.
On May 15, 2026, Intel plunged nearly 7%. Nvidia, AMD, and Micron Technology all fell sharply, with analysts warning that valuations in the AI sector have become stretched. The top 10 companies in the S&P 500 account for roughly 40% of its total value. When those companies move lower, the entire index feels the impact.
At the same time, the AI story is showing its resilience in other ways. Cerebras — a newly public AI chipmaker — surged 68% on its IPO day on Thursday, closing in on $100 billion in valuation despite having just over $500 million in 2025 revenue. Google’s stock showed impressive growth earlier in the week with a 3.94% price increase. And according to BlackRock’s latest analysis, AI-linked economies like South Korea and Taiwan have outperformed the MSCI World Index since the start of the Middle East conflict.
The message is clear: AI is still a growth driver, but investors are no longer giving open-ended credit for AI investment without evidence of real returns. The market is becoming more discriminating.
Signal 6: Global Markets Split Along AI Lines
BlackRock’s latest weekly commentary — published in May 2026 — highlights a notable pattern in global markets since the start of the Iran conflict.
Emerging market and US equities are leading global markets, driven by strong AI-linked earnings. Countries directly exposed to the energy shock have lagged significantly. But markets tied to the AI manufacturing chain — specifically South Korea and Taiwan — have outperformed.
Meanwhile, Europe is facing a different picture entirely. Markets are pricing in approximately three rate hikes in Europe as inflation pressures build from rising energy costs. That is in sharp contrast to the US, where no rate change is currently expected. This divergence in monetary policy creates opportunity and risk across currencies and international investments.
The UK faces additional pressure. A brewing political crisis threatening Prime Minister Keir Starmer’s leadership is adding volatility to British gilts, pushing 30-year yields to their highest level in 28 years.
Signal 7: The Empire State Manufacturing Surprise
Not all the news today is negative. One signal that could point to resilience in the US economy deserves attention.
The Empire State Manufacturing Index — a monthly survey of New York State manufacturers — leaped to 19.6 in May 2026, up from 11.0 in April. Analysts had expected a reading of just 6.2. A reading above zero indicates expansion, and this number comfortably exceeded all expectations.
That kind of manufacturing data tells investors that parts of the US economy are holding up despite the inflationary pressures. It reduces the immediate risk of a recession — but it also gives the Fed less urgency to cut rates, which is a double-edged sword for stock investors.
What Should Investors Do Today? Latest Analysis
With this many signals moving at once, staying calm and focused on facts is the most important thing an investor can do.
Here is what the signals collectively suggest:
Watch the 10-year Treasury yield closely. If it pushes consistently above 4.6% and holds there, expect more pressure on high-valuation tech stocks and the broader market.
The VIX approaching 20 is your volatility warning light. If it crosses and holds above 20, consider whether your portfolio is positioned for a bumpier ride.
Oil prices are the key variable. Any credible progress on the Iran conflict or the Strait of Hormuz would likely cause bond yields to fall, oil prices to drop, and risk assets to rally. Watch diplomatic headlines carefully.
Sector rotation is already happening. Energy, utilities, industrials, and healthcare have shown more resilience in this inflationary environment than tech. Investors who concentrate only in mega-cap AI names carry more concentration risk than they may realise.
The rally is real but narrow. Only half the stocks in the S&P 500 are above their 50-day moving average. Broad participation is the mark of a healthy bull market. Narrow participation is a yellow light.
Always consult a licensed financial advisor before making changes to your investment portfolio. Every investor’s situation — their timeline, tax position, and risk tolerance — is different, and no single market signal is the whole story.
As of May 15, 2026, the most important signals include the 10-year US Treasury yield hitting 4.55–4.6% (a one-year high), the VIX rising above 19 and approaching the 20 danger threshold, Brent crude oil near $109 per barrel, the S&P 500’s narrow rally with only half of stocks above their 50-day moving average, and a 45% probability priced into markets for a Fed rate hike in 2026.
Global markets fell on May 15, 2026 because Treasury yields surged to one-year highs, oil prices climbed above $109 per barrel, and diplomatic talks between the US and China failed to produce progress on ending the Iran conflict or reopening the Strait of Hormuz. The Dow Jones fell over 537 points, the S&P 500 dropped 1.24%, and the Nasdaq fell 1.54%. Tech stocks led the decline, with Intel falling nearly 7%.
The VIX — also known as the fear gauge — measures expected stock market volatility. A VIX below 15 suggests calm markets, while a reading above 20 historically signals heightened uncertainty and often precedes sharper market swings. On May 15, 2026, the VIX rose 6.78% to 18.43, touching above 19 intraday. Investors approaching VIX 20 should review their exposure to high-risk, high-valuation assets.
The Iran conflict, which began on February 28, 2026, effectively closed the Strait of Hormuz — a shipping lane carrying around 20% of global oil. This has pushed oil prices up nearly 80% since the start of 2026. Higher oil costs feed into inflation, delay Fed rate cuts, and put pressure on corporate profit margins. Bond yields have surged globally, and markets are now pricing in a 45% chance of a US rate hike in 2026 — up from just 1% a month ago.
The S&P 500’s forward 12-month price-to-earnings ratio stood at 20.9 by late April 2026 — above the five-year average of 19.9 and the ten-year average of 18.9. Only about half of all stocks in the index are currently above their 50-day moving average, signalling a narrow rally driven mainly by AI-linked mega-cap companies. Analysts at Schwab note that resistance sits at 7,450 to 7,500, with support at 7,030.
According to BlackRock’s May 2026 analysis, US and emerging market equities are leading global markets, driven by AI-linked earnings growth. South Korea and Taiwan have outperformed the MSCI World Index due to their role in the AI supply chain. In contrast, markets directly exposed to the energy shock from the Iran conflict have lagged. Europe faces added pressure from rising inflation, with markets pricing in around three rate hikes there in 2026.
Sectors with strong pricing power tend to outperform when inflation is high and yields are rising. In 2026, energy, utilities, industrials, materials, and healthcare have shown more resilience than high-growth tech stocks, which suffer most when higher yields reduce the value of future earnings. Investors often use these defensive and cyclical sectors to balance portfolios during inflationary periods. Always speak with a licensed financial advisor before making sector shifts.