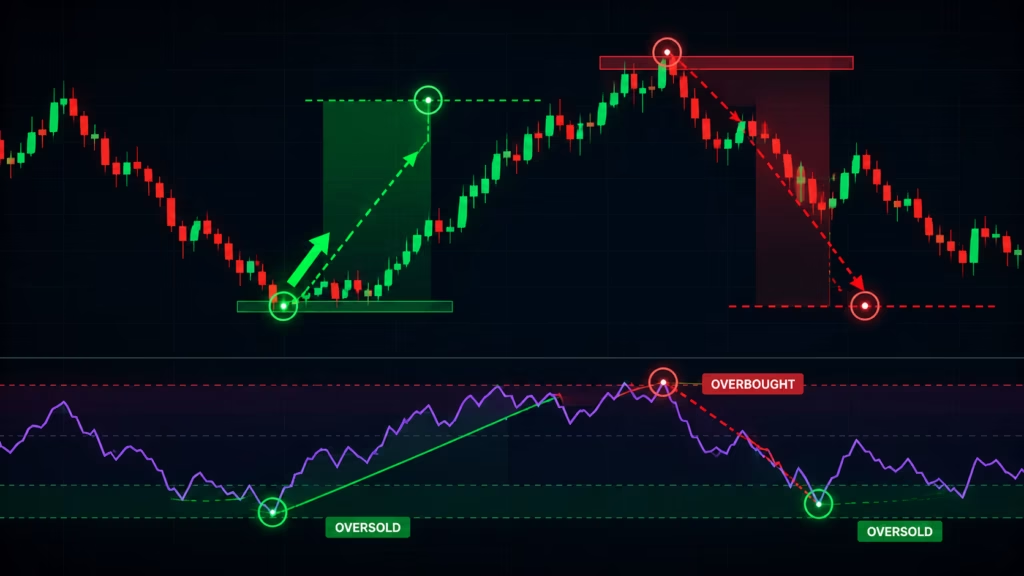
If you want to trade RSI signals with better timing and lower risk, you need more than just the basic overbought and oversold rules. The Relative Strength Index, created by J. Welles Wilder in 1978, remains one of the most widely used momentum indicators in trading today. But most traders use it wrong, and that mistake costs them money. This guide gives you the real rules, the best settings, and the confirmation tools that actually work in live markets.
What Is RSI and What Does It Actually Measure?
RSI is a momentum oscillator that measures the speed and strength of a price move. It runs on a scale from 0 to 100. Most traders know the basic rule: above 70 is overbought, below 30 is oversold. But that is only the surface.
Here is the deeper truth that changes how you trade it: RSI measures momentum, not a guaranteed reversal point. A high RSI reading above 70 means strong bullish momentum is present, not that the price must fall immediately. In strong uptrends, the best price moves often happen while RSI is above 70 and stays there. Blindly selling every time RSI crosses 70 is one of the most expensive mistakes a beginner can make.
The 50 Midline: The Level Most Traders Ignore
The 50 level on RSI is more important than most traders realize. When RSI is above 50, the market has a bullish bias. When it is below 50, the bias is bearish. Traders who use the 50 midline as a trend filter make significantly better entries than those who only watch the 70 and 30 extremes.
A rising RSI that crosses above 50 from below is an early signal that momentum is shifting from bearish to bullish. A falling RSI that drops below 50 from above signals the opposite. This single level, watched on a daily or four-hour chart, can act as a reliable directional filter for shorter-timeframe entries.
The Most Common RSI Settings and Which One to Use
The default RSI setting is 14 periods. This means the indicator looks back at the last 14 candles to calculate momentum. It works well across many timeframes and markets as a balanced starting point.
But the right setting depends entirely on how you trade.
Day traders working on one-minute to five-minute charts often shorten the period to 5, 7, or 9. A shorter RSI responds faster to price changes, giving earlier signals. The tradeoff is more false signals, so shorter RSI periods need more confirmation from other tools.
Swing traders using daily or four-hour charts generally stick with the 14-period default. Some swing traders use a longer period like 21 to smooth the readings and filter out small fluctuations that do not matter for multi-day positions.
For high-volatility assets like crypto or fast-moving stocks, widening the overbought and oversold bands from the standard 70/30 to 80/20 cuts down on false reversal signals significantly.
The 80-20 Strategy for Volatile Markets
The 80-20 RSI strategy shifts the thresholds up and down to account for more extreme price moves. Instead of treating 70 as overbought and 30 as oversold, you wait for RSI to reach 80 before considering a short, and 20 before considering a long. This approach filters out the weaker signals and focuses on only the strongest momentum extremes. For day traders on volatile assets today, this adjustment alone can noticeably improve signal quality.
How to Trade RSI Signals with Better Timing and Lower Risk
The single biggest improvement most traders can make is this: stop acting on RSI alone. The indicator should confirm a trade, not create one.
Here is the framework that professional traders follow.
Step 1: Identify the Market Regime First
Before looking at RSI, ask one question: is this market trending or ranging? This matters more than any indicator setting.
In a trending market, RSI works as a continuation tool. You look for pullbacks where RSI dips toward 40 to 50 in an uptrend and then turns back up, giving you a chance to enter with the trend at a better price. You do not fade the trend just because RSI touched 70.
In a ranging market, RSI works as a mean-reversion tool. You buy when RSI reaches 30 and sell when it reaches 70, expecting price to bounce between the range’s support and resistance. The same indicator used with the wrong bias for the wrong market type will consistently lose money.
Step 2: Wait for RSI to Cross Back Through the Extreme Zone
One of the most reliable timing improvements any RSI trader can make is to wait for RSI to cross back through the extreme level rather than acting at the extreme level itself.
Do not buy the moment RSI hits 30. Wait for RSI to drop below 30 and then cross back above it. That crossback is the actual signal. It tells you that the selling momentum has peaked and buyers are beginning to regain control. The same logic applies in reverse for overbought conditions. Wait for RSI to drop back below 70 before initiating a short. This simple rule eliminates a large percentage of premature entries.
Step 3: Confirm with a Second Tool
RSI divergence strategies tested over 10-year periods show success rates between 55% and 65% when used alone. Adding a second confirmation tool pushes accuracy higher and cuts false-entry risk meaningfully.
The three most effective tools to pair with RSI are:
Moving averages give you the trend direction. If the 20-period or 50-period moving average is pointing up and price is above it, only take RSI buy signals. Ignore sell signals. This keeps you on the right side of the trend.
Volume confirms the strength behind a price move. An RSI reversal signal that comes alongside above-average volume is far stronger than one happening on thin trading. If RSI crosses back above 30 while volume is expanding, the reversal has real buying participation behind it.
Support and resistance levels give you a price-based reason to act at the same level where RSI is signaling. An RSI oversold reading that lands exactly at a key support level on the chart is a much higher-probability setup than an RSI reading in open space with no nearby price structure.
RSI Divergence: The Highest-Quality Signal on the Chart
RSI divergence is the most powerful signal the indicator produces, and it consistently ranks as one of the highest-quality technical analysis signals available today.
Bullish divergence happens when price makes a lower low but RSI makes a higher low. This tells you that even though price is dropping, the selling momentum is actually weakening. The downtrend is losing energy. A reversal may be coming.
Bearish divergence happens when price makes a higher high but RSI makes a lower high. Price is still climbing but momentum is fading at the top. This often appears before a meaningful pullback or reversal in the market.
The key rule with divergence is that it needs confirmation before you act. Do not trade a divergence signal alone. Wait for a candlestick pattern, a break of a short-term trendline, or a support/resistance level break to confirm that price has actually changed direction before entering. Acting on divergence without confirmation leads to premature entries and unnecessary losses.
How to Draw RSI Trendlines for Clearer Signals
One practical technique that adds precision to divergence trading is drawing trendlines directly on the RSI indicator itself. If you can draw a falling trendline across RSI peaks and then RSI breaks above that trendline, it is often an early signal that bullish momentum is returning. The same applies in reverse for bearish signals. A rising RSI trendline that breaks downward signals weakening momentum before price often confirms the move.
Multi-Timeframe RSI Analysis: The Professional Approach
The most reliable RSI setups use multiple timeframes working together. This is how professional traders use the indicator today.
Start on the daily chart to understand the overall trend direction. Use RSI on the daily to determine whether the broad bias is bullish, above 50, or bearish, below 50. This sets your trading direction for the day or the week.
Move to the four-hour chart to identify the specific setup. Look for RSI reaching an extreme zone or divergence forming at a key level. This is where you identify your trade candidate.
Drop to the one-hour or 15-minute chart to time the actual entry. Wait for the RSI crossback through the extreme zone on this shorter timeframe, combined with your confirmation tool, before placing the trade.
This top-down approach means you only take short-term signals that align with the larger trend, which dramatically reduces the number of trades that work against you.
Risk Management Rules Every RSI Trader Needs
Better timing is only half the equation. Lower risk requires specific rules around every trade.
Always define your stop-loss before entering. When you enter a long position based on an RSI oversold signal, your stop goes below the most recent swing low. If price returns to that low and breaks it, the trade setup is no longer valid and you exit. This prevents small losses from becoming large ones.
Respect position sizing. No single RSI trade should risk more than 1% to 2% of your total trading capital. This keeps you in the game through the inevitable losing trades that every strategy produces.
Accept that RSI will produce false signals in trending markets. In a strong uptrend, RSI can stay above 70 for an extended period. In a strong downtrend, it can stay below 30. No indicator prevents all losses. Your risk management rules are the only thing that limits how much any single false signal costs you.
Latest RSI Strategy Adjustments for 2026 Markets
Today’s markets have specific characteristics that influence how RSI performs. Volatility in crypto markets, AI-driven momentum in tech stocks, and fast-moving currency pairs all create environments where the standard 70/30 levels produce more false signals than in calmer conditions.
The practical adjustments working for traders today include using 80/20 bands on crypto and high-beta stocks, shortening RSI to 9 periods when intraday signals are needed faster, and placing heavier weight on divergence signals that appear at the same level as key horizontal support or resistance rather than acting on RSI readings alone.
The 60-50 crossover method is also gaining traction among swing traders in 2026. Rather than waiting for extreme RSI readings, this approach watches for RSI to cross above 60 as a bullish momentum confirmation and cross below 40 as a bearish confirmation. It catches trend entries earlier and avoids the problem of only acting when price is already deeply extended.
Putting It All Together: A Simple RSI Trading Checklist
Before entering any RSI-based trade, work through this checklist.
Identify the market regime: trending or ranging. Choose the RSI setting that matches your timeframe. Check the 50 midline for directional bias. Wait for RSI to cross back through the extreme zone, not just touch it. Confirm with at least one other tool: moving average, volume, or support/resistance. Check for divergence between price and RSI as an added quality filter. Define your stop-loss level before entering. Size your position to risk no more than 1% to 2% of capital.
This process takes longer than acting on the first RSI signal you see. But it produces meaningfully better results and keeps your losses small when the trade does not work out.
Frequently Asked Questions
RSI, or the Relative Strength Index, measures the speed and strength of price momentum on a scale from 0 to 100. A reading above 70 traditionally signals strong bullish momentum often labeled overbought, and a reading below 30 signals strong bearish momentum often labeled oversold. Importantly, RSI measures momentum strength, not a guaranteed reversal point, which is why context and confirmation always matter before acting on any RSI reading.
For day trading on five-minute to fifteen-minute charts, an RSI period of 9 to 14 works well for most markets. For faster one-minute to two-minute scalping, periods as short as 5 to 7 produce quicker signals but require stronger confirmation from other tools due to higher false-signal rates. For high-volatility assets like crypto, adjusting the overbought and oversold bands to 80 and 20 instead of the default 70 and 30 cuts down on false entries significantly.
RSI divergence happens when price and the RSI indicator move in opposite directions. Bullish divergence occurs when price makes a lower low but RSI makes a higher low, signaling weakening selling momentum and a possible upside reversal. Bearish divergence occurs when price makes a higher high but RSI makes a lower high, signaling fading buying momentum before a potential pullback. Always wait for candlestick confirmation, a trendline break, or a support and resistance level reaction before entering on a divergence signal.
No. RSI works best as a confirmation tool, not a standalone trading system. Used alone, RSI divergence strategies historically show success rates of 55% to 65%, which is not high enough to overcome transaction costs and losing trades. Pairing RSI with moving averages for trend direction, volume for participation confirmation, and support and resistance levels for price-based reasons to act produces meaningfully stronger and more reliable trade setups.
The 50 level on RSI is the midpoint of the indicator’s scale and acts as a directional bias marker. When RSI is above 50, market momentum is broadly bullish. When it is below 50, momentum is broadly bearish. Many professional traders use RSI crossing above or below 50 as a trend filter, only taking long trades when RSI is above 50 and only taking short trades when it is below 50. This single rule keeps traders on the correct side of the market’s overall momentum.
In a trending market, RSI works as a continuation tool. In an uptrend, look for RSI to pull back toward the 40 to 50 zone and then turn back up as an entry opportunity to buy with the trend. Do not sell just because RSI reaches 70 in an uptrend. In a ranging market, RSI works as a mean-reversion tool, where you buy near the 30 level and sell near the 70 level, expecting price to bounce between the range boundaries. Identifying the market regime first is the most important step before applying any RSI strategy.
The RSI crossback entry technique means waiting for RSI to move through an extreme zone and then cross back out of it before entering a trade, rather than acting the moment RSI first touches the extreme level. For a buy signal, you wait for RSI to drop below 30 and then cross back above 30. For a sell signal, you wait for RSI to rise above 70 and then cross back below 70. This simple timing adjustment removes many premature entries and significantly improves the average quality of RSI-based trades.