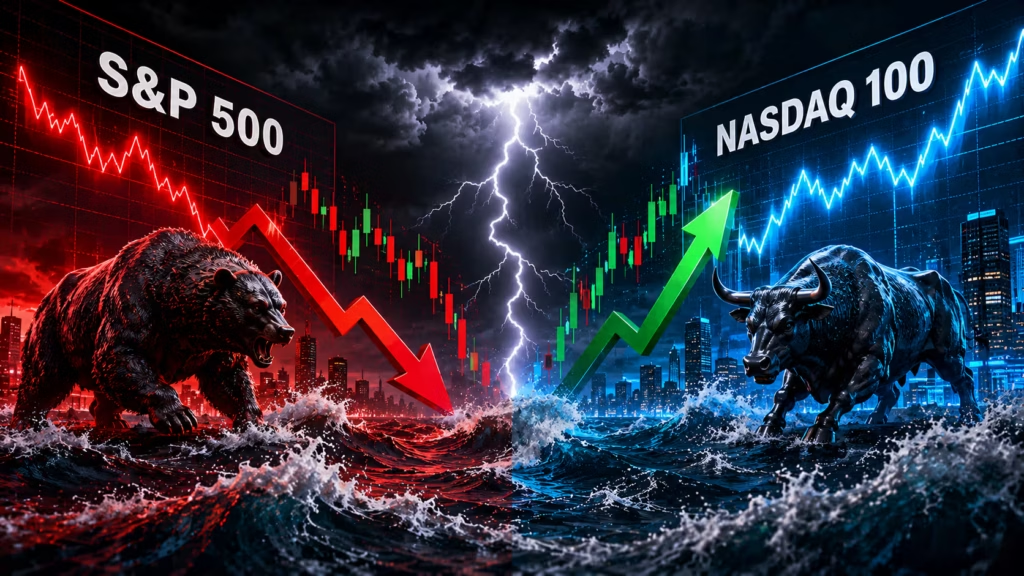
Markets don’t move in a straight line. Prices swing up and down, fear grips investors, and uncertainty takes over. When that happens, the VIX — Wall Street’s official “fear gauge” — spikes sharply. Understanding how S&P 500 and Nasdaq 100 stocks react when volatility rises can make the difference between panic-selling at the wrong moment and staying calm with a clear strategy.
Here is a fact-based, up-to-date breakdown of exactly what happens — backed by the most dramatic volatility event of recent years.
What Is Market Volatility and Why Does It Matter?
Volatility simply means how much and how fast prices move. The CBOE Volatility Index, or VIX, measures the expected price swings in S&P 500 options over the next 30 days.
When the VIX is low — say, below 15 — markets are calm and investors feel confident. When the VIX climbs above 20 or 25, fear is rising. When it spikes past 30, the market is in serious stress mode.
The relationship between the VIX and stocks is almost always inverse. When stocks fall hard, the VIX shoots up. When stocks rally, the VIX drops. Historical data shows the VIX and the S&P 500 have a correlation of about -0.70, meaning they move in opposite directions roughly 79% of the time on a daily basis.
How S&P 500 and Nasdaq 100 Stocks React When Volatility Rises
The two indices don’t react the same way when the VIX spikes. Their composition is very different, and that matters a great deal.
The S&P 500 holds 500 companies across all 11 major sectors — technology, healthcare, energy, financials, consumer staples, and more. It offers broader diversification.
The Nasdaq 100 tracks 100 of the largest non-financial companies listed on the Nasdaq exchange. It is heavily concentrated in technology — names like Apple, Microsoft, Nvidia, Alphabet, Amazon, and Meta. This makes the Nasdaq 100 more sensitive to volatility spikes than the S&P 500.
The April 2025 VIX Spike: A Real-World Case Study
The clearest recent example happened on April 7, 2025 — a date markets will not forget quickly.
After the Trump administration announced sweeping new tariffs on April 2nd — a 10% minimum rate on all imports and a 34% increase on Chinese goods — fear exploded across Wall Street.
The VIX spiked to an intraday peak of 60.13 on April 7, the fifth-highest level ever recorded since 1990 and the highest since the COVID crash of March 2020. The closing high of 52.33 on April 8th was the most extreme close since that same pandemic panic.
Here is what happened to the indices during that storm:
The S&P 500 fell 13.8% from its Q1 closing level to the April 7 low. The Nasdaq 100 dropped a stunning 23% from its February 19 high to its April 8 low — briefly entering official bear market territory. The Nasdaq Composite shed 14.5% from its Q1 close in just days.
This shows exactly how much harder the Nasdaq 100 gets hit when volatility explodes. Its heavy tech weighting and premium valuations leave little room for error when fear takes hold.
Why Nasdaq 100 Stocks Fall Harder When the VIX Spikes
Tech stocks are what analysts call “high-beta” — they amplify market moves, both up and down. When fear rises, investors tend to sell their most expensive, highest-growth bets first.
Companies like Nvidia, Meta, Alphabet, and Tesla all closed sharply lower on high-volatility days in 2025. Their lofty valuations — built on future earnings expectations — get repriced fast when uncertainty enters the picture. During the August 2025 VIX spike triggered by weak jobs data, the Nasdaq sank 2.43% in a single session while the S&P 500 lost 1.8%.
The Nasdaq 100 also has essentially zero exposure to financials and minimal weight in energy and utilities — the sectors that sometimes hold up better in a storm.
What S&P 500 Sectors Hold Up Best When Volatility Rises
Here is where the story gets more nuanced. Within the S&P 500, not all stocks fall equally when the VIX spikes. Investors rotate into defensive sectors — companies whose earnings stay stable regardless of what the economy does.
In Q1 2025, when the overall S&P 500 returned -4.6% as volatility spiked, the defensive corners of the index told a very different story:
Healthcare stocks gained 6.1% while the broad index fell. Consumer staples climbed 4.6%, reaching their highest relative strength versus consumer discretionary stocks since Election Day. Utilities advanced 4.1%, outperforming the index by a wide margin. Energy stocks surged 9.3%, partly driven by rising natural gas prices.
Meanwhile, the consumer discretionary sector — packed with retail and luxury spending stocks — tumbled more than 6%.
The practical takeaway: when the VIX climbs above 20, experienced investors tend to boost allocations to healthcare and utilities, pulling back from cyclical and growth sectors.
The VIX and Sector Rotation Today
Latest analysis from 2026 shows this rotation is still playing out. As the VIX has hovered in the mid-to-upper teens in early 2026, sector leadership has shifted away from the tech giants that dominated 2025 toward defensive and cyclical areas including energy and consumer staples, both of which have recently reached all-time highs.
Utilities are currently outperforming the S&P 500, highlighting fresh investor demand for defensive positioning. When the VIX exceeds 20, financial advisors typically recommend boosting healthcare and utilities allocations by 2–3% and pulling that weight from more cyclical sectors.
The Volatility Paradox of Late 2025
One of the most unusual market dynamics of recent times appeared in late 2025: the S&P 500 hovered near a record high of 6,950 while the VIX refused to settle down. This “spot-up, vol-up” environment confused analysts and investors alike.
The explanation was that the memory of April’s VIX spike to 60 had fundamentally changed investor behavior. Traders became far more aggressive in buying downside protection — hedging through options — even as prices rose. The fear of getting caught off-guard again was very real.
This kind of elevated “background volatility” even during a rally shows that understanding the VIX is not just about reacting to crashes. It’s about reading what institutional investors are really thinking beneath the surface of rising prices.
The Rebound: Why VIX Spikes Are Often Buying Signals
Here is the part that surprises many investors. Extreme VIX spikes have historically marked strong buying opportunities, not permanent market damage.
After the April 7, 2025 intraday VIX high of 60.13, a more-than-35% broad market rally followed. The Nasdaq 100 fully erased its 2025 losses by May 13, reversing a roughly $5 trillion wipeout in a matter of weeks. For the full year 2025, the Nasdaq 100 delivered a total return of 21%, topping the S&P 500 by 3 percentage points.
Historically, the only other times the VIX exceeded 60 were the 2008 Global Financial Crisis and the 2020 COVID crash. Both times, equity markets bottomed around the same period the VIX began retreating below 31.
The pattern is consistent: extreme fear creates extreme selling, which creates extreme value. Long-term investors who stay in the market — or add during spikes — tend to benefit the most.
What Today’s VIX Level Tells Us
As of late May 2026, the VIX is trading near 16.70, well within its 52-week range of 13.38 to 35.30. The S&P 500 has climbed to around 7,473 and the Nasdaq is near 26,344.
This relatively low VIX signals a calmer market environment today. But the lessons of April 2025 remain fresh. Volatility can return quickly, triggered by a tariff announcement, a Fed surprise, a geopolitical shock, or an unexpected earnings miss from a mega-cap tech company.
The smart move is not to predict the next spike. It’s to understand how your portfolio will behave when one arrives.
Key Takeaways for Investors
The Nasdaq 100 is more volatile than the S&P 500 by nature. When the VIX spikes, Nasdaq 100 stocks typically fall harder and faster than S&P 500 stocks as a whole, because tech valuations compress quickly under fear.
Defensive S&P 500 sectors — healthcare, consumer staples, utilities — hold up far better during high-VIX environments. Investors who rotate toward these sectors during calm periods are better positioned when storms hit.
Extreme VIX spikes above 50–60 have historically marked market bottoms, not tops. Panic selling at the peak of fear has cost investors dearly in every major cycle.
The Nasdaq 100’s long-term performance remains strong — a 21% return in 2025 and a 78% win rate versus the S&P 500 over the past 18 calendar years — but its volatility requires patience and a strong stomach.
The VIX, or CBOE Volatility Index, measures expected price swings in S&P 500 options over the next 30 days. It is often called the ‘fear gauge’ because it tends to spike when stocks fall and drop when stocks rally. Historically, the VIX and the S&P 500 have a strong inverse relationship, moving in opposite directions about 79% of the time on any given trading day.
The Nasdaq 100 is heavily concentrated in high-growth technology stocks like Apple, Microsoft, Nvidia, and Alphabet. These stocks carry high valuations based on future earnings expectations. When fear rises and the VIX spikes, investors sell their most expensive bets first, causing tech-heavy indices like the Nasdaq 100 to drop more sharply than the broader and more diversified S&P 500.
On April 7, 2025, the VIX hit an intraday high of 60.13 — the highest level since the COVID crash of March 2020 — following a major tariff announcement. The S&P 500 fell 13.8% from its Q1 closing level, while the Nasdaq 100 plunged 23% from its February high, briefly entering bear market territory. However, both indices recovered strongly, with the Nasdaq 100 erasing all its 2025 losses by May 13 and ending the year up 21%.
Defensive sectors tend to outperform during high-volatility periods. In Q1 2025, when the S&P 500 returned -4.6% overall, healthcare gained 6.1%, consumer staples rose 4.6%, and utilities climbed 4.1%. These sectors deliver stable earnings regardless of economic conditions, which is why investors rotate into them when fear rises and the VIX spikes above 20.
Historically, extreme VIX spikes have marked strong buying opportunities rather than permanent damage. After the April 2025 spike to 60.13, a more-than-35% broad market rally followed. The only other times the VIX exceeded 60 — the 2008 financial crisis and the 2020 COVID crash — both represented eventual market bottoms. Long-term investors who stayed invested or added during those spikes were rewarded.
As of late May 2026, the VIX is trading near 16.70, within a 52-week range of 13.38 to 35.30. This relatively low reading signals calmer market conditions today. The S&P 500 trades near 7,473 and the Nasdaq near 26,344. However, volatility can return quickly in response to tariff changes, Federal Reserve surprises, or geopolitical shocks, so staying diversified and understanding your risk exposure remains important.
Despite its higher short-term volatility, the Nasdaq 100 has delivered impressive long-term returns. According to Nasdaq data, the index has beaten the S&P 500 in 14 of the past 18 calendar years, giving it a 78% win rate. Its cumulative return over that 18-year period was 2.4 times that of the S&P 500 (1,342% vs. 560%), or about 45% higher on an annualized basis. In 2025 alone, the Nasdaq 100 delivered a 21% total return, topping the S&P 500 by 3 percentage points.